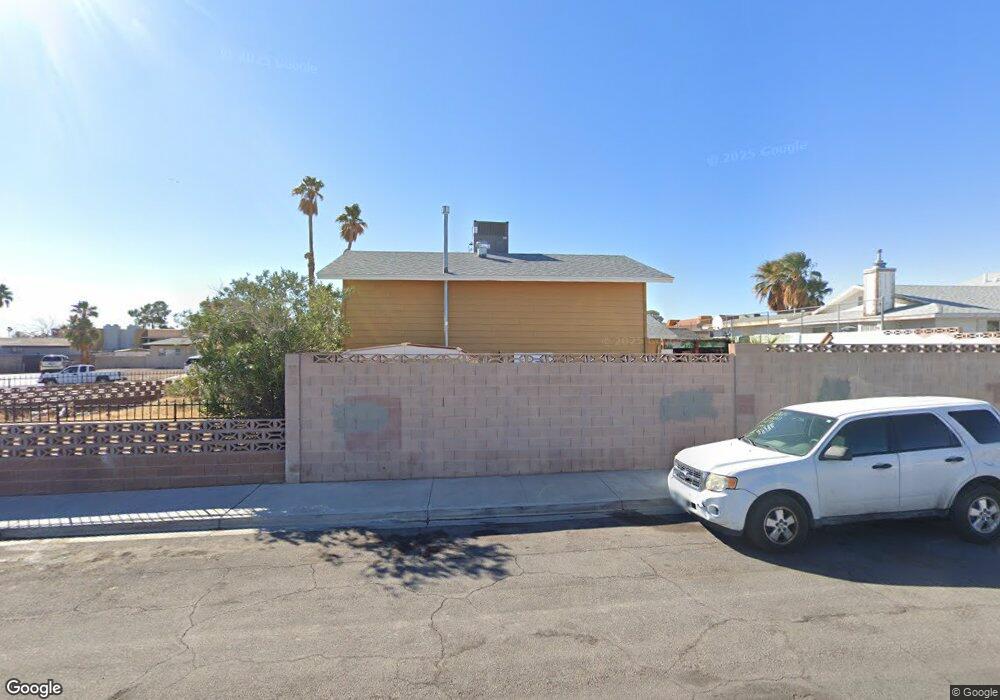
800 Sanford Ct Unit 2 Las Vegas, NV 89107
Charleston Preservation NeighborhoodEstimated Value: $424,284 - $528,000
4
Beds
3
Baths
2,144
Sq Ft
$220/Sq Ft
Est. Value
About This Home
This home is located at 800 Sanford Ct Unit 2, Las Vegas, NV 89107 and is currently estimated at $471,071, approximately $219 per square foot. 800 Sanford Ct Unit 2 is a home located in Clark County with nearby schools including Rose Warren Elementary School, Frank F Garside Junior High School, and Bonanza High School.
Ownership History
Date
Name
Owned For
Owner Type
Purchase Details
Closed on
Jan 22, 2008
Sold by
Miller Julie S and Miller Julis S
Bought by
Miller Julie S
Current Estimated Value
Home Financials for this Owner
Home Financials are based on the most recent Mortgage that was taken out on this home.
Original Mortgage
$171,200
Outstanding Balance
$108,121
Interest Rate
6.17%
Mortgage Type
New Conventional
Estimated Equity
$362,950
Purchase Details
Closed on
Oct 29, 2003
Sold by
Nevp Llc
Bought by
Miller Julie S
Home Financials for this Owner
Home Financials are based on the most recent Mortgage that was taken out on this home.
Original Mortgage
$126,320
Interest Rate
5%
Mortgage Type
New Conventional
Purchase Details
Closed on
Jul 22, 2003
Sold by
Coil Larry Lee and Coil Linda
Bought by
Nevp Llc
Purchase Details
Closed on
Nov 5, 1993
Sold by
Coil Larry L and Coil Linda
Bought by
Coil Larry Lee and Coil Linda
Home Financials for this Owner
Home Financials are based on the most recent Mortgage that was taken out on this home.
Original Mortgage
$95,500
Interest Rate
6.91%
Create a Home Valuation Report for This Property
The Home Valuation Report is an in-depth analysis detailing your home's value as well as a comparison with similar homes in the area
Home Values in the Area
Average Home Value in this Area
Purchase History
| Date | Buyer | Sale Price | Title Company |
|---|---|---|---|
| Miller Julie S | -- | Title Court Service Inc | |
| Miller Julie S | $157,900 | National Title Company | |
| Nevp Llc | $99,805 | National Title Company | |
| Coil Larry Lee | -- | Fidelity National Title |
Source: Public Records
Mortgage History
| Date | Status | Borrower | Loan Amount |
|---|---|---|---|
| Open | Miller Julie S | $171,200 | |
| Closed | Miller Julie S | $126,320 | |
| Previous Owner | Coil Larry Lee | $95,500 |
Source: Public Records
Tax History Compared to Growth
Tax History
| Year | Tax Paid | Tax Assessment Tax Assessment Total Assessment is a certain percentage of the fair market value that is determined by local assessors to be the total taxable value of land and additions on the property. | Land | Improvement |
|---|---|---|---|---|
| 2025 | $1,529 | $61,577 | $30,800 | $30,777 |
| 2024 | $1,485 | $61,577 | $30,800 | $30,777 |
| 2023 | $1,485 | $58,067 | $30,450 | $27,617 |
| 2022 | $1,442 | $51,373 | $25,200 | $26,173 |
| 2021 | $1,400 | $49,160 | $23,450 | $25,710 |
| 2020 | $1,356 | $46,017 | $19,600 | $26,417 |
| 2019 | $1,317 | $44,174 | $17,500 | $26,674 |
| 2018 | $1,278 | $40,916 | $14,700 | $26,216 |
| 2017 | $1,352 | $41,245 | $14,000 | $27,245 |
| 2016 | $1,212 | $39,025 | $10,150 | $28,875 |
| 2015 | $1,208 | $36,543 | $7,700 | $28,843 |
| 2014 | $1,171 | $34,647 | $5,250 | $29,397 |
Source: Public Records
Map
Nearby Homes
- 6701 Theus Cir
- 6709 Theus Cir
- 6612 Burgundy Way
- 6508 Bourbon Way
- 6741 Chehalis Cir
- 6444 Bannock Way
- 421 Courtney Ln
- 408 Greenfield Ln
- 6432 Bannock Way
- 6449 Alta Dr
- 404 Vassar Ln
- 6749 W Charleston Blvd Unit 2
- 6749 W Charleston Blvd Unit 3
- 901 Rockaway St
- 6420 Evergreen Ave
- 6412 Bristol Way
- 416 Lindy Dr
- 904 Rockaway St
- 6723 W Charleston Blvd Unit 4
- 6721 W Charleston Blvd Unit 3
- 6625 Evergreen Ave
- 804 Sanford Ct Unit 27D2
- 812 Connie Ct
- 6616 Evergreen Ave
- 6620 Evergreen Ave
- 808 Sanford Ct Unit 27D2
- 6612 Evergreen Ave Unit 27D2
- 801 Sanford Ct
- 6624 Evergreen Ave
- 805 Sanford Ct
- 808 Connie Ct
- 6608 Evergreen Ave
- 732 Connie Dr
- 6617 Bristol Way
- 800 Connie Ct
- 6621 Bristol Way
- 728 Connie Dr
- 6613 Bristol Way
- 804 Connie Ct
- 6604 Evergreen Ave