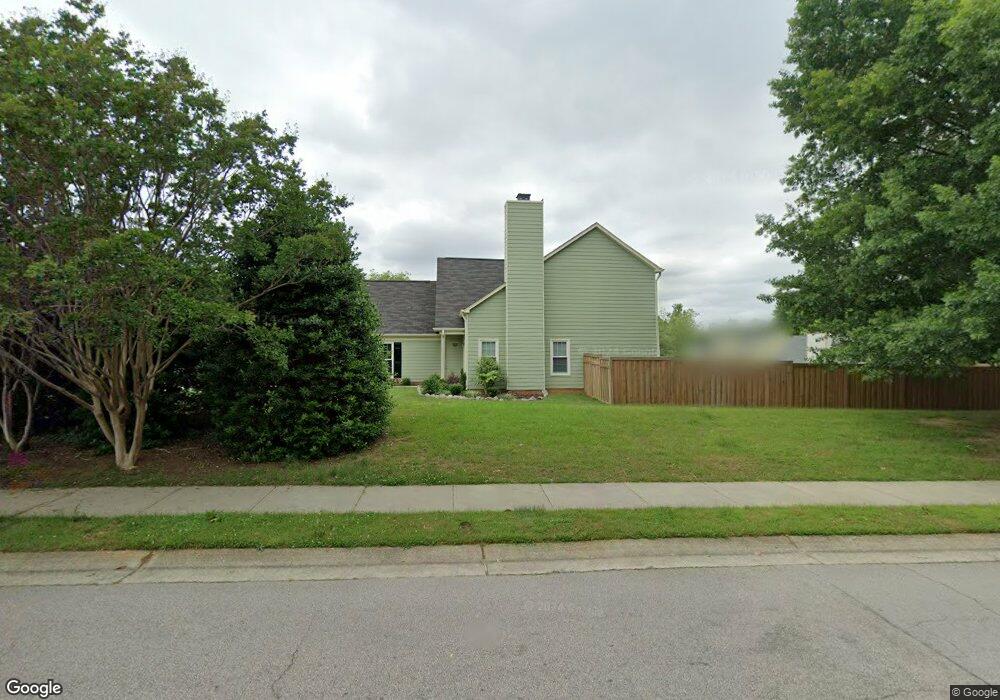
800 Starkland Way Holly Springs, NC 27540
Estimated Value: $393,000 - $436,000
4
Beds
3
Baths
1,781
Sq Ft
$234/Sq Ft
Est. Value
About This Home
This home is located at 800 Starkland Way, Holly Springs, NC 27540 and is currently estimated at $417,529, approximately $234 per square foot. 800 Starkland Way is a home located in Wake County with nearby schools including Oakview Elementary School, Apex Friendship Middle School, and Holly Springs High School.
Ownership History
Date
Name
Owned For
Owner Type
Purchase Details
Closed on
Dec 17, 2019
Sold by
Bc Redesign Llc
Bought by
Bartolo Fr Jeftey P and Hayes Heather A
Current Estimated Value
Home Financials for this Owner
Home Financials are based on the most recent Mortgage that was taken out on this home.
Original Mortgage
$274,025
Outstanding Balance
$241,593
Interest Rate
3.6%
Mortgage Type
New Conventional
Estimated Equity
$175,937
Purchase Details
Closed on
Jul 23, 2019
Sold by
Coy Jody Hull and Coy Jody Dawn
Bought by
Bc Redesign Llc
Home Financials for this Owner
Home Financials are based on the most recent Mortgage that was taken out on this home.
Original Mortgage
$182,000
Interest Rate
3.8%
Mortgage Type
Future Advance Clause Open End Mortgage
Purchase Details
Closed on
Apr 4, 2017
Sold by
Coy Jedy Wayne and Coy Gary Woyne
Bought by
Coy Jody Null and Coy Jody Hull
Purchase Details
Closed on
Nov 30, 1995
Bought by
Coy Gary Wayne
Create a Home Valuation Report for This Property
The Home Valuation Report is an in-depth analysis detailing your home's value as well as a comparison with similar homes in the area
Home Values in the Area
Average Home Value in this Area
Purchase History
| Date | Buyer | Sale Price | Title Company |
|---|---|---|---|
| Bartolo Fr Jeftey P | $282,500 | None Available | |
| Bc Redesign Llc | $210,000 | None Available | |
| Coy Jody Null | -- | None Available | |
| Coy Gary Wayne | $136,000 | -- |
Source: Public Records
Mortgage History
| Date | Status | Borrower | Loan Amount |
|---|---|---|---|
| Open | Bartolo Fr Jeftey P | $274,025 | |
| Previous Owner | Bc Redesign Llc | $182,000 |
Source: Public Records
Tax History Compared to Growth
Tax History
| Year | Tax Paid | Tax Assessment Tax Assessment Total Assessment is a certain percentage of the fair market value that is determined by local assessors to be the total taxable value of land and additions on the property. | Land | Improvement |
|---|---|---|---|---|
| 2025 | $3,517 | $406,339 | $115,000 | $291,339 |
| 2024 | $3,502 | $406,339 | $115,000 | $291,339 |
| 2023 | $2,806 | $258,303 | $50,000 | $208,303 |
| 2022 | $2,709 | $258,303 | $50,000 | $208,303 |
| 2021 | $2,659 | $258,303 | $50,000 | $208,303 |
| 2020 | $2,659 | $258,303 | $50,000 | $208,303 |
| 2019 | $2,448 | $201,809 | $50,000 | $151,809 |
| 2018 | $2,213 | $201,809 | $50,000 | $151,809 |
| 2017 | $2,134 | $201,809 | $50,000 | $151,809 |
| 2016 | $2,105 | $201,809 | $50,000 | $151,809 |
| 2015 | $1,929 | $181,895 | $35,000 | $146,895 |
| 2014 | $1,863 | $181,895 | $35,000 | $146,895 |
Source: Public Records
Map
Nearby Homes
- 717 Starkland Way
- 713 Littleleaf Ct
- 725 Little Leaf Ct
- 108 Crabwall Ct
- 105 Townsgate Ct
- 321 Blalock St
- 329 N Main St
- 318 Blalock St
- 109 Bright Shade Ct
- 225 Douglas St
- 124 Cliffdale Rd
- 112 Burt St
- 737 W Holly Springs Rd
- 743 W Holly Springs Rd
- 105 Cross Hill Ln
- 749 W Holly Springs Rd
- 755 W Holly Springs Rd
- 761 W Holly Springs Rd
- 321 Cross Hill Ln
- 112 Sanchez Ct
- 804 Starkland Way
- 1001 Silverstone Way
- 900 Starkland Way
- 1000 Silverstone Way
- 1005 Silverstone Way
- 101 Marleton Way
- 904 Starkland Way
- 100 Marleton Way
- 204 Hallwood Ct
- 716 Starkland Way
- 105 Marleton Way
- 105 Marlton Way
- 1009 Silverstone Way
- 104 Marleton Way
- 905 Starkland Way
- 1004 Silverstone Way
- 109 Marleton Way
- 908 Starkland Way
- 712 Starkland Way
- 200 Hallwood Ct