
Seller's Agent in 2025
Jamieson Hodgson
John L. Scott Port Ludlow
(360) 437-6437
14 Total Sales
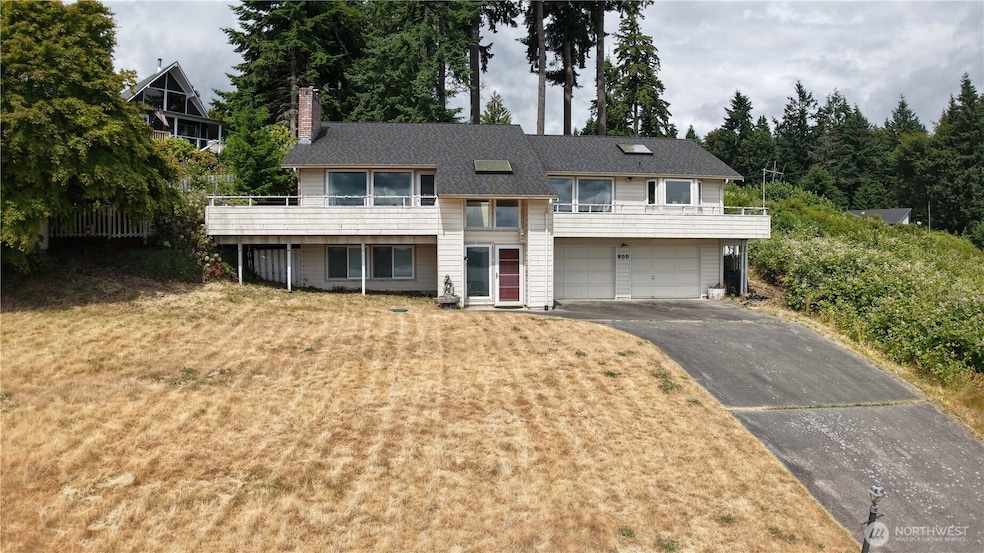
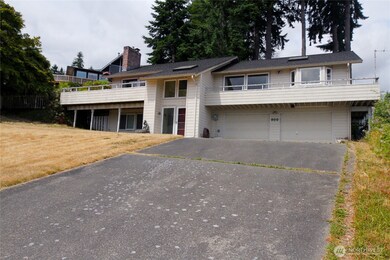
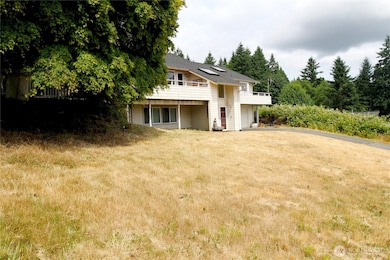
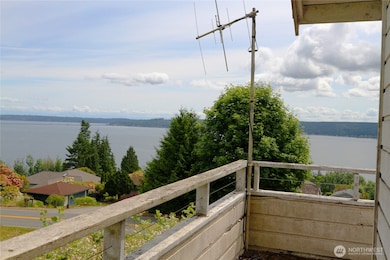
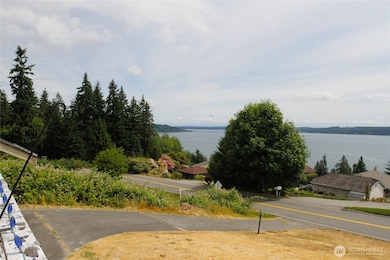
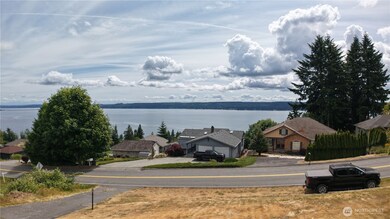
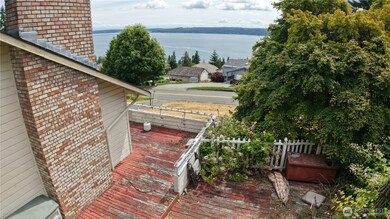
Great opportunity in the Bridgehaven neighborhood, remodel to your liking! Enjoy the community boat launch, club house and trail system nearby. The front porch, kitchen and living room have commanding views of the hood canal, and are spectacular vantage point during sunset. This home is minutes from Port Ludlow, Poulsbo and other communities. Bring your paint pallets, plans and make your dream come true!
Last Agent to Sell the Property
John L. Scott Port Ludlow License #24016692 Listed on: 06/20/2025
Source: Northwest Multiple Listing Service (NWMLS)
MLS#: 2396003
| Date | Type | Sale Price | Title Company |
|---|---|---|---|
| Warranty Deed | -- | Horizon Title Group |
| Date | Status | Loan Amount | Loan Type |
|---|---|---|---|
| Open | $450,500 | VA |
| Date | Event | Price | List to Sale | Price per Sq Ft |
|---|---|---|---|---|
| 07/23/2025 07/23/25 | Sold | $415,000 | -25.9% | $163 / Sq Ft |
| 06/26/2025 06/26/25 | Pending | -- | -- | -- |
| 06/20/2025 06/20/25 | For Sale | $560,000 | -- | $220 / Sq Ft |
| Year | Tax Paid | Tax Assessment Tax Assessment Total Assessment is a certain percentage of the fair market value that is determined by local assessors to be the total taxable value of land and additions on the property. | Land | Improvement |
|---|---|---|---|---|
| 2024 | $3,490 | $462,643 | $136,500 | $326,143 |
| 2023 | $3,490 | $436,963 | $125,000 | $311,963 |
| 2022 | $3,194 | $417,783 | $120,000 | $297,783 |
| 2021 | $3,264 | $345,240 | $104,000 | $241,240 |
| 2020 | $3,115 | $332,305 | $100,000 | $232,305 |
| 2019 | $2,837 | $306,435 | $92,000 | $214,435 |
| 2018 | $3,094 | $280,566 | $84,000 | $196,566 |
| 2017 | $2,877 | $271,631 | $84,000 | $187,631 |
| 2016 | $2,851 | $258,696 | $80,000 | $178,696 |
| 2015 | $2,811 | $254,318 | $75,000 | $179,318 |
| 2014 | -- | $254,318 | $75,000 | $179,318 |
| 2013 | -- | $254,320 | $75,000 | $179,320 |
Seller's Agent in 2025
Jamieson Hodgson
John L. Scott Port Ludlow
(360) 437-6437
14 Total Sales
R
Buyer's Agent in 2025
Rachael Whaley
Heaton Dainard, LLC
(425) 301-2222
7 Total Sales
Source: Northwest Multiple Listing Service (NWMLS)
MLS Number: 2396003
APN: 935100022
Disclaimer: Certain information contained herein is derived from information provided by parties other than Homes.com. All information provided is deemed reliable, but is not guaranteed to be accurate and should be independently verified.
![]() All data is obtained from various sources and may not have been verified by broker or MLS GRID. Supplied Open House Information is subject to change without notice. All information should be independently reviewed and verified for accuracy. Properties may or may not be listed by the office/agent presenting the information. Listing information is provided by the Northwest Multiple Listing Service (NWMLS). Property information is based on available data that may include MLS information, county records, and other sources. Listings marked with the 3 tree icon and provided by NWMLS. All properties are subject to prior sale or withdrawal. IDX information is provided exclusively for consumers’ personal noncommercial use, that it may not be used for any purpose other than to identify prospective properties consumers may be interested in purchasing, that the data is deemed reliable but is not guaranteed by MLS GRID. ©2025 NWMLS.
All data is obtained from various sources and may not have been verified by broker or MLS GRID. Supplied Open House Information is subject to change without notice. All information should be independently reviewed and verified for accuracy. Properties may or may not be listed by the office/agent presenting the information. Listing information is provided by the Northwest Multiple Listing Service (NWMLS). Property information is based on available data that may include MLS information, county records, and other sources. Listings marked with the 3 tree icon and provided by NWMLS. All properties are subject to prior sale or withdrawal. IDX information is provided exclusively for consumers’ personal noncommercial use, that it may not be used for any purpose other than to identify prospective properties consumers may be interested in purchasing, that the data is deemed reliable but is not guaranteed by MLS GRID. ©2025 NWMLS.
Based on information submitted to the MLS GRID