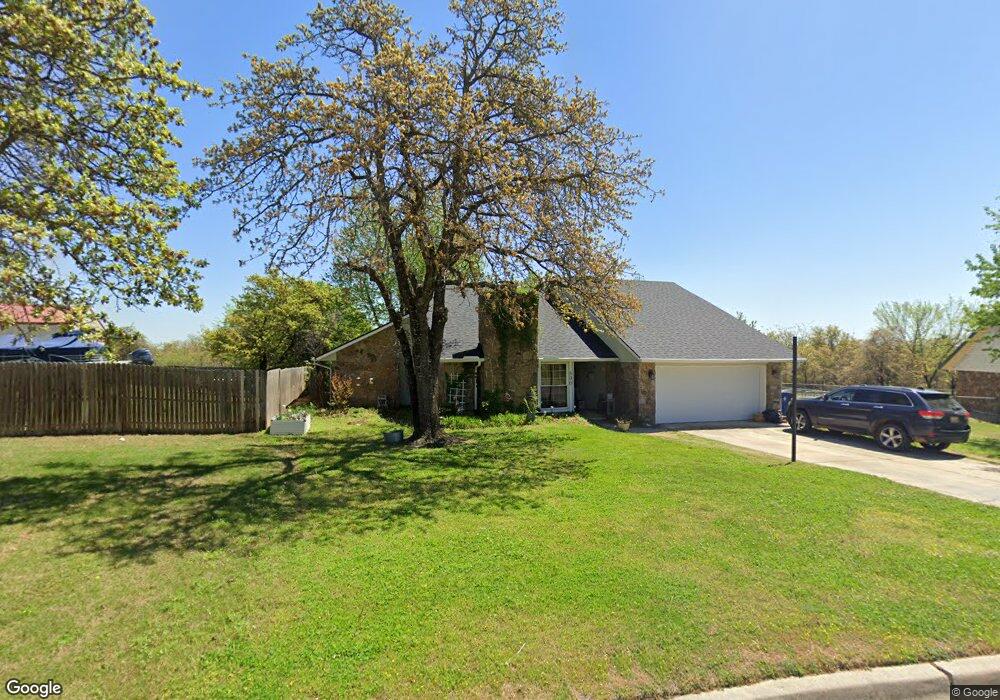
800 Twisted Oak Dr Choctaw, OK 73020
Estimated Value: $216,000 - $246,000
3
Beds
2
Baths
1,725
Sq Ft
$133/Sq Ft
Est. Value
About This Home
This home is located at 800 Twisted Oak Dr, Choctaw, OK 73020 and is currently estimated at $228,655, approximately $132 per square foot. 800 Twisted Oak Dr is a home located in Oklahoma County with nearby schools including L.W. Westfall Elementary School, Nicoma Park Middle School, and Choctaw High School.
Ownership History
Date
Name
Owned For
Owner Type
Purchase Details
Closed on
Dec 11, 2009
Sold by
Bland Jimmy P and Bland Lori
Bought by
Strickland Lola
Current Estimated Value
Home Financials for this Owner
Home Financials are based on the most recent Mortgage that was taken out on this home.
Original Mortgage
$126,564
Outstanding Balance
$82,213
Interest Rate
4.82%
Mortgage Type
FHA
Estimated Equity
$146,442
Purchase Details
Closed on
Sep 15, 2005
Sold by
Atchley Michael David and Atchley Darcie Jean
Bought by
Bland Jimmy P
Home Financials for this Owner
Home Financials are based on the most recent Mortgage that was taken out on this home.
Original Mortgage
$105,094
Interest Rate
5.76%
Mortgage Type
FHA
Purchase Details
Closed on
Aug 9, 2000
Sold by
Pender Patricia K
Bought by
Atchley Michael David and Atchley Darcie Jean
Create a Home Valuation Report for This Property
The Home Valuation Report is an in-depth analysis detailing your home's value as well as a comparison with similar homes in the area
Home Values in the Area
Average Home Value in this Area
Purchase History
| Date | Buyer | Sale Price | Title Company |
|---|---|---|---|
| Strickland Lola | $129,000 | Stewart Abstract & Title Of | |
| Bland Jimmy P | $106,000 | Stewart Escrow & Title Midwe | |
| Atchley Michael David | $88,000 | Stewart Abstract & Title |
Source: Public Records
Mortgage History
| Date | Status | Borrower | Loan Amount |
|---|---|---|---|
| Open | Strickland Lola | $126,564 | |
| Previous Owner | Bland Jimmy P | $105,094 |
Source: Public Records
Tax History Compared to Growth
Tax History
| Year | Tax Paid | Tax Assessment Tax Assessment Total Assessment is a certain percentage of the fair market value that is determined by local assessors to be the total taxable value of land and additions on the property. | Land | Improvement |
|---|---|---|---|---|
| 2024 | $2,067 | $18,383 | $2,605 | $15,778 |
| 2023 | $2,067 | $17,508 | $2,783 | $14,725 |
| 2022 | $1,937 | $16,675 | $2,846 | $13,829 |
| 2021 | $1,845 | $15,881 | $2,571 | $13,310 |
| 2020 | $1,767 | $15,125 | $2,805 | $12,320 |
| 2019 | $1,769 | $15,130 | $2,679 | $12,451 |
| 2018 | $1,690 | $14,410 | $0 | $0 |
| 2017 | $1,667 | $14,245 | $2,805 | $11,440 |
| 2016 | $1,631 | $13,860 | $2,805 | $11,055 |
| 2015 | $1,564 | $13,274 | $2,805 | $10,469 |
| 2014 | $1,580 | $13,276 | $2,805 | $10,471 |
Source: Public Records
Map
Nearby Homes
- 714 Oak Park Dr
- 1006 Oak Park Dr
- 14388 Timberdale Dr
- 14374 Timberdale Dr
- 0 NE Rd Unit 1145972
- 14356 NE 4th St
- 900 N Choctaw Rd
- 14327 Redvine Rd
- 0 Morningside Dr
- 1304 Lighthorsemen Way
- 1316 Lighthorsemen Way
- 1300 Lighthorsemen Way
- 1313 Lighthorsemen Way
- 1309 Lighthorsemen Way
- 1312 Lighthorsemen Way
- 1311 Pushmataha Blvd
- 1721 Cherokee Trail
- 1306 Lighthorsemen Way
- 1306 Pushmataha Blvd
- 1308 Pushmataha Blvd
- 14620 NE 6th St
- 830 Twisted Oak Dr
- 810 Twisted Oak Dr
- 14610 NE 6th St
- 14625 NE 6th St
- 815 Twisted Oak Dr
- 850 Twisted Oak Dr
- 730 Oak Hill Rd
- 835 Twisted Oak Dr
- 14605 NE 6th St
- 790 Oak Hill Rd
- 870 Twisted Oak Dr
- 810 Oak Hill Rd
- 830 Oak Hill Rd
- 875 Twisted Oak Dr
- 14590 NE 6th St
- 890 Twisted Oak Dr
- 850 Oak Hill Rd
- 14595 NE 6th St