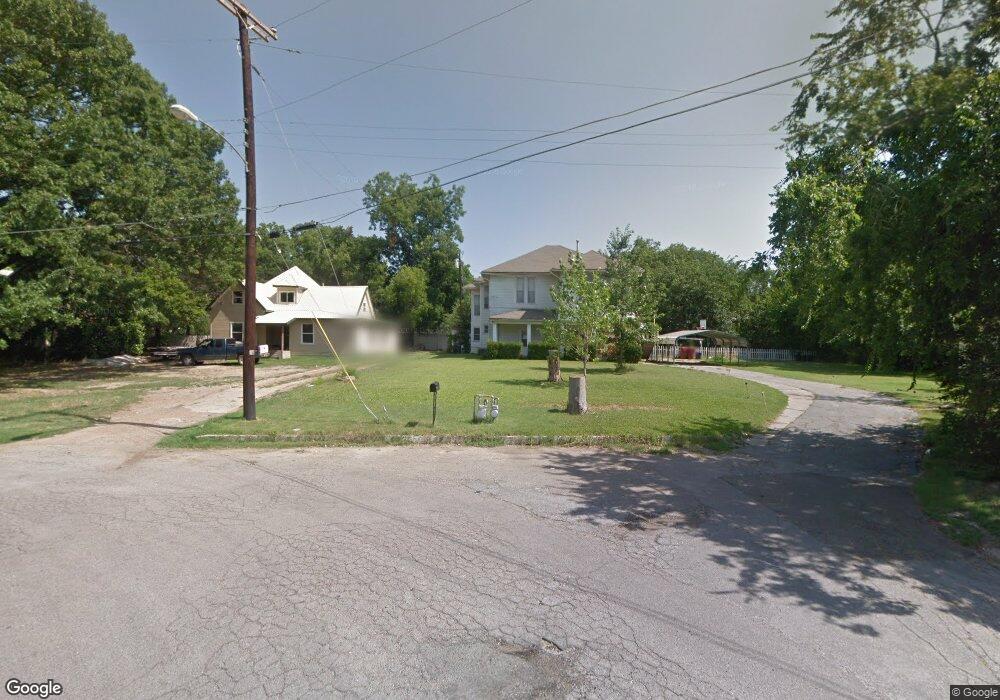
800 W 5th St Bonham, TX 75418
Estimated Value: $248,000 - $381,000
--
Bed
1
Bath
5,145
Sq Ft
$58/Sq Ft
Est. Value
About This Home
This home is located at 800 W 5th St, Bonham, TX 75418 and is currently estimated at $297,928, approximately $57 per square foot. 800 W 5th St is a home located in Fannin County with nearby schools including Finley-Oates Elementary School, LH Rather Jr High School, and Morning Star Academy.
Ownership History
Date
Name
Owned For
Owner Type
Purchase Details
Closed on
Nov 16, 2005
Sold by
Reunard Johnnie Mae
Bought by
Mcurry Steven I and Mcurry Barbara
Current Estimated Value
Home Financials for this Owner
Home Financials are based on the most recent Mortgage that was taken out on this home.
Original Mortgage
$72,800
Outstanding Balance
$39,119
Interest Rate
5.92%
Estimated Equity
$258,809
Create a Home Valuation Report for This Property
The Home Valuation Report is an in-depth analysis detailing your home's value as well as a comparison with similar homes in the area
Home Values in the Area
Average Home Value in this Area
Purchase History
| Date | Buyer | Sale Price | Title Company |
|---|---|---|---|
| Mcurry Steven I | -- | None Available |
Source: Public Records
Mortgage History
| Date | Status | Borrower | Loan Amount |
|---|---|---|---|
| Open | Mcurry Steven I | $72,800 |
Source: Public Records
Tax History Compared to Growth
Tax History
| Year | Tax Paid | Tax Assessment Tax Assessment Total Assessment is a certain percentage of the fair market value that is determined by local assessors to be the total taxable value of land and additions on the property. | Land | Improvement |
|---|---|---|---|---|
| 2025 | -- | $233,300 | $69,690 | $163,610 |
| 2024 | $3,209 | $213,930 | $65,070 | $148,860 |
| 2023 | $2,966 | $201,680 | $50,850 | $150,830 |
| 2022 | $3,007 | $195,120 | $40,180 | $154,940 |
| 2021 | $3,142 | $130,560 | $19,420 | $111,140 |
| 2020 | $2,888 | $129,280 | $15,680 | $113,600 |
| 2019 | $2,730 | $127,580 | $10,450 | $117,130 |
| 2018 | $2,505 | $97,800 | $10,450 | $87,350 |
| 2017 | $2,195 | $85,900 | $8,530 | $77,370 |
| 2016 | $2,064 | $80,760 | $15,290 | $65,470 |
| 2015 | -- | $76,320 | $13,850 | $62,470 |
| 2014 | -- | $78,910 | $13,850 | $65,060 |
Source: Public Records
Map
Nearby Homes