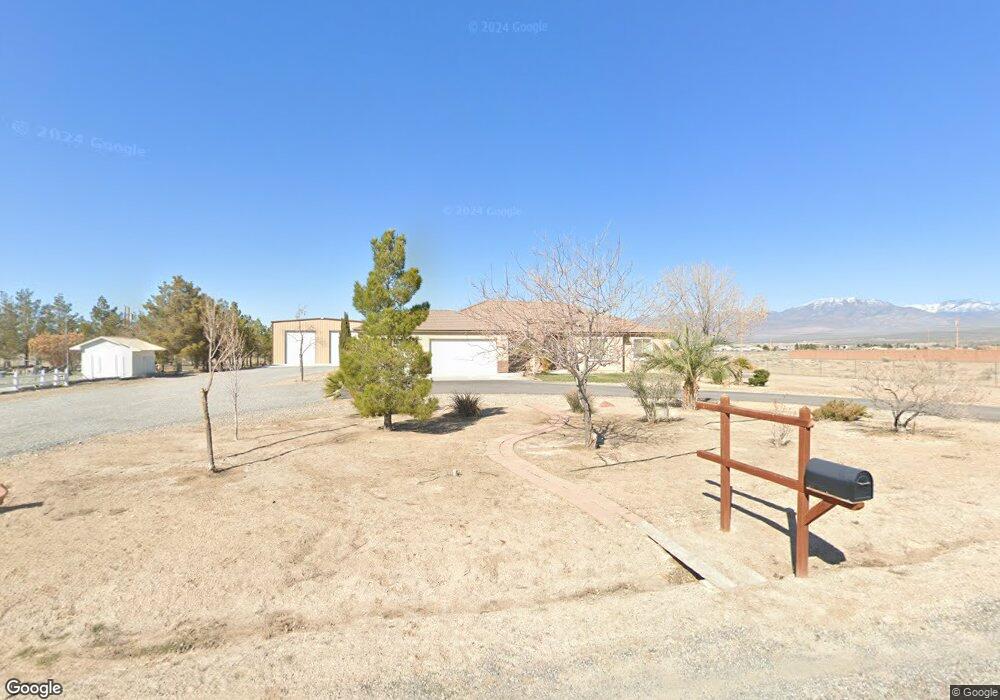
800 W Chipmunk Rd Pahrump, NV 89048
Estimated Value: $541,795 - $805,000
--
Bed
--
Bath
5,608
Sq Ft
$110/Sq Ft
Est. Value
About This Home
This home is located at 800 W Chipmunk Rd, Pahrump, NV 89048 and is currently estimated at $618,449, approximately $110 per square foot. 800 W Chipmunk Rd is a home located in Nye County with nearby schools including J.G. Johnson Elementary School, Rosemary Clarke Middle School, and Pahrump Valley High School.
Ownership History
Date
Name
Owned For
Owner Type
Purchase Details
Closed on
May 17, 2024
Sold by
Ross Scott and Engen Lori
Bought by
Ross Scott
Current Estimated Value
Purchase Details
Closed on
Jul 11, 2018
Sold by
Rivas Ralph and Rivas Mary Helen
Bought by
Ross Scott and Engen Lori
Home Financials for this Owner
Home Financials are based on the most recent Mortgage that was taken out on this home.
Original Mortgage
$276,000
Interest Rate
4.6%
Mortgage Type
New Conventional
Purchase Details
Closed on
Mar 20, 2012
Sold by
Rivas Ralph and Rivas Mary Helen
Bought by
The Coyote Valley Family Trust
Purchase Details
Closed on
Sep 29, 2009
Sold by
Rivas Ralph D and Rivas Ralph
Bought by
Rivas Ralph and Rivas Mary Helen
Purchase Details
Closed on
Feb 25, 2008
Sold by
Rivas Mary H
Bought by
Rivas Ralph
Purchase Details
Closed on
Feb 16, 2008
Sold by
Teegardin Curtis L
Bought by
Rivas Ralph and Rivas Ralph D
Create a Home Valuation Report for This Property
The Home Valuation Report is an in-depth analysis detailing your home's value as well as a comparison with similar homes in the area
Home Values in the Area
Average Home Value in this Area
Purchase History
| Date | Buyer | Sale Price | Title Company |
|---|---|---|---|
| Ross Scott | $135,381 | Stewart Title | |
| Ross Scott | $345,000 | None Available | |
| The Coyote Valley Family Trust | -- | None Available | |
| Rivas Ralph | -- | None Available | |
| Rivas Ralph | -- | Equity Title Pahrump | |
| Rivas Ralph D | -- | Equity Title Pahrump | |
| Rivas Ralph | $50,000 | Equity Title Pahrump |
Source: Public Records
Mortgage History
| Date | Status | Borrower | Loan Amount |
|---|---|---|---|
| Previous Owner | Ross Scott | $276,000 |
Source: Public Records
Tax History Compared to Growth
Tax History
| Year | Tax Paid | Tax Assessment Tax Assessment Total Assessment is a certain percentage of the fair market value that is determined by local assessors to be the total taxable value of land and additions on the property. | Land | Improvement |
|---|---|---|---|---|
| 2025 | $3,874 | $142,595 | $4,135 | $138,460 |
| 2024 | $3,874 | $144,364 | $4,135 | $140,229 |
| 2023 | $3,592 | $135,381 | $4,135 | $131,246 |
| 2022 | $3,323 | $121,896 | $4,135 | $117,761 |
| 2021 | $2,400 | $95,906 | $3,308 | $92,598 |
| 2020 | $2,272 | $94,548 | $3,308 | $91,240 |
| 2019 | $2,127 | $114,208 | $3,308 | $110,900 |
| 2018 | $2,066 | $109,874 | $2,646 | $107,228 |
| 2017 | $2,007 | $88,027 | $2,646 | $85,381 |
| 2016 | $1,957 | $60,529 | $2,646 | $57,883 |
| 2015 | $1,953 | $55,980 | $2,646 | $53,334 |
| 2014 | $1,897 | $60,557 | $2,646 | $57,911 |
Source: Public Records
Map
Nearby Homes
- 540 Brady Ln
- 1141 Turquoise Ave
- 1431 Silver Peak Ave
- 1640 Silver Peak Ave
- 601 W Nevada Highway 372
- 1141 W Chipmunk Rd
- 561 W Nevada Highway 372
- 541 W Nevada Highway 372
- 1580 Tiptop Trail
- 1500 Peacock Ave
- 867 S Linda St
- 1171 Dutch Ford St
- 1340 Adams Rd
- 1250 SW Comstock Cir
- 1280 S Adams Rd
- 1441 W Dutch Ford Rd
- 311 Ferndell St
- 291 Greenwater St
- 290 Kite St
- 300 Copper Flats Dr
- 800 W Chipmunk Rd
- 830 Chipmunk Rd
- 830 W Chipmunk Rd
- 870 Chipmunk Rd
- 1300 Silver Peak Ave
- 730 W Chipmunk Rd
- 870 W Chipmunk Rd
- 900 Chipmunk Rd
- 1331 Silver Peak Ave
- 1200 Red Rock Dr
- 561 Brady Ln
- 941 Brady Ln
- 761 Brady Ln
- 930 Chipmunk Rd
- 1300 Red Rock Dr
- 1301 Tiptop Trail
- 1361 Silver Peak Ave
- 1330 Red Rock Dr
- 930 W Chipmunk Rd
- 1360 Red Rock Dr