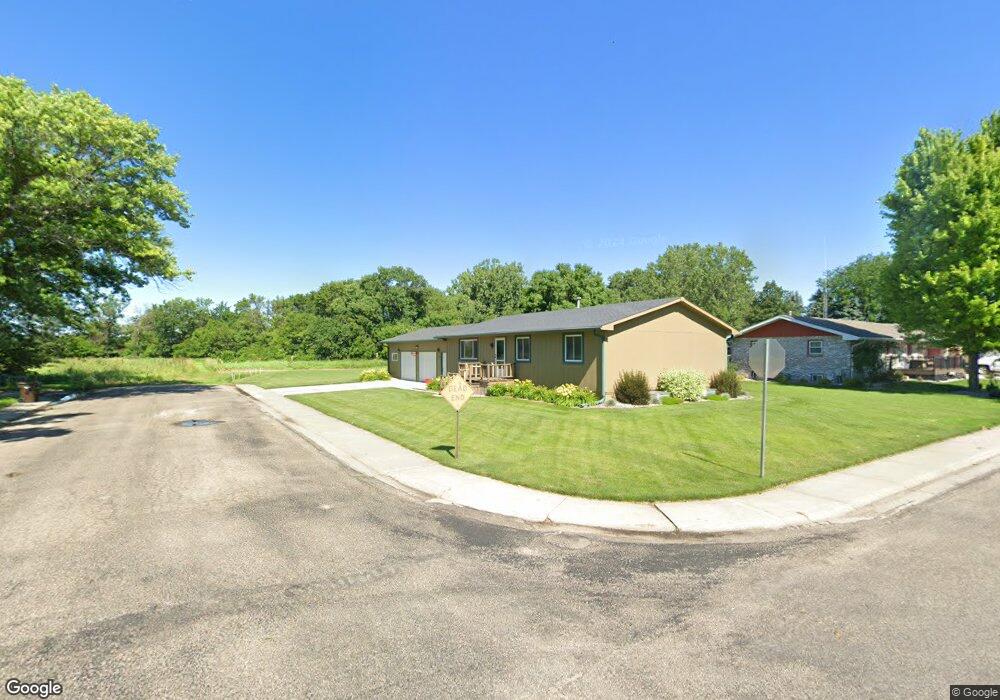
800 W Klein St Battle Creek, NE 68715
Estimated Value: $248,000 - $287,000
3
Beds
2
Baths
1,188
Sq Ft
$221/Sq Ft
Est. Value
About This Home
This home is located at 800 W Klein St, Battle Creek, NE 68715 and is currently estimated at $262,878, approximately $221 per square foot. 800 W Klein St is a home located in Madison County with nearby schools including Battle Creek Elementary School and Battle Creek High School.
Ownership History
Date
Name
Owned For
Owner Type
Purchase Details
Closed on
Jul 17, 2013
Sold by
Wemhoff Gregory M and Wemhoff Joyce R
Bought by
Hardt James W
Current Estimated Value
Home Financials for this Owner
Home Financials are based on the most recent Mortgage that was taken out on this home.
Original Mortgage
$30,000
Outstanding Balance
$21,879
Interest Rate
3.99%
Mortgage Type
Credit Line Revolving
Estimated Equity
$240,999
Purchase Details
Closed on
Apr 6, 2004
Sold by
Buhl Jeremy J
Bought by
Wemhoff Gregory M and Wemhoff Joyce R
Purchase Details
Closed on
Mar 30, 2004
Sold by
Buhl Jeremy J
Bought by
Buhl Jeremy J
Purchase Details
Closed on
Jul 16, 2003
Sold by
Zelazny Marc J and Zelazny Shelia M
Bought by
Gmac Global Relocation Services Inc
Purchase Details
Closed on
Jul 9, 2003
Sold by
Gmac Global Relocation Services Inc
Bought by
Buhl Jeremy J
Purchase Details
Closed on
Jul 19, 2002
Sold by
Reisser Bruce D and Reisser Sally J
Bought by
Zelazny Marc J and Zelazny Shelia M
Create a Home Valuation Report for This Property
The Home Valuation Report is an in-depth analysis detailing your home's value as well as a comparison with similar homes in the area
Home Values in the Area
Average Home Value in this Area
Purchase History
| Date | Buyer | Sale Price | Title Company |
|---|---|---|---|
| Hardt James W | $120,000 | Dataquick Title Llc | |
| Wemhoff Gregory M | $103,000 | -- | |
| Buhl Jeremy J | $62,428 | -- | |
| Gmac Global Relocation Services Inc | $98,500 | -- | |
| Buhl Jeremy J | $98,500 | -- | |
| Zelazny Marc J | $89,000 | -- |
Source: Public Records
Mortgage History
| Date | Status | Borrower | Loan Amount |
|---|---|---|---|
| Open | Hardt James W | $30,000 |
Source: Public Records
Tax History Compared to Growth
Tax History
| Year | Tax Paid | Tax Assessment Tax Assessment Total Assessment is a certain percentage of the fair market value that is determined by local assessors to be the total taxable value of land and additions on the property. | Land | Improvement |
|---|---|---|---|---|
| 2024 | $2,254 | $178,603 | $16,875 | $161,728 |
| 2023 | $3,063 | $171,252 | $16,875 | $154,377 |
| 2022 | $2,862 | $160,034 | $16,875 | $143,159 |
| 2021 | $2,747 | $157,233 | $16,875 | $140,358 |
| 2020 | $2,526 | $145,644 | $16,875 | $128,769 |
| 2019 | $266 | $145,644 | $16,875 | $128,769 |
| 2018 | $1,196 | $134,709 | $16,875 | $117,834 |
| 2017 | $2,126 | $127,852 | $16,088 | $111,764 |
| 2016 | $2,088 | $120,957 | $16,088 | $104,869 |
| 2015 | $2,073 | $120,957 | $16,088 | $104,869 |
| 2014 | $2,004 | $110,374 | $14,625 | $95,749 |
| 2013 | $2,267 | $110,374 | $14,625 | $95,749 |
Source: Public Records
Map
Nearby Homes
- 202 Highland Dr
- 101 N 4th St
- 103 N 4th St
- 303 S Boyer St
- 304 E Herman St
- 401 E Hale St
- 000 836th 1 2 Rd
- 834th Rd 542nd Ave
- 0 See Legal Unit 250827
- 5105 W Sherwood Rd
- SEE Legal
- 84529 542 Ave
- 856 S 4th St
- 854 4th St
- 4801 N Deer Run Dr
- 84453 539th Ave
- 3900 Madison Ave
- 3507 Bradford Ave
- 3506 Bradford Ave
- 3407 Bradford Ave