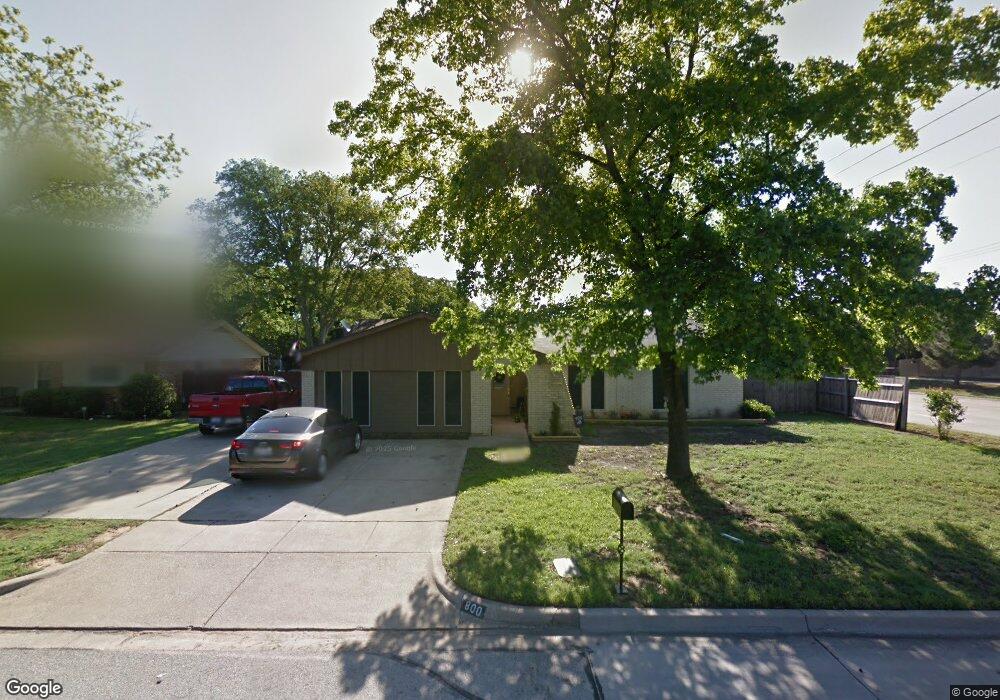
800 Warwick St Bedford, TX 76022
Estimated Value: $325,000 - $357,000
3
Beds
2
Baths
1,960
Sq Ft
$175/Sq Ft
Est. Value
About This Home
This home is located at 800 Warwick St, Bedford, TX 76022 and is currently estimated at $343,966, approximately $175 per square foot. 800 Warwick St is a home located in Tarrant County with nearby schools including Bell Manor Elementary School, Central J High School, and Trinity High School.
Ownership History
Date
Name
Owned For
Owner Type
Purchase Details
Closed on
Jun 25, 2014
Sold by
Robinson Clifton H and Robinson Holly M
Bought by
Biggars Billy R and Biggars Stephanie
Current Estimated Value
Home Financials for this Owner
Home Financials are based on the most recent Mortgage that was taken out on this home.
Original Mortgage
$165,938
Outstanding Balance
$126,358
Interest Rate
4.23%
Mortgage Type
FHA
Estimated Equity
$217,608
Purchase Details
Closed on
Apr 14, 2011
Sold by
Robinson Clifton H and Robinson Holly M
Bought by
Robinson Clifton H and Robinson Holly M
Purchase Details
Closed on
Apr 6, 2011
Sold by
Cota Holly M and Robinson Holly M
Bought by
Robinson Clifton H and Robinson Holly M
Purchase Details
Closed on
Nov 17, 2000
Sold by
Norman John Anderson and Norman Ina Evelyn
Bought by
Cota Holly M
Home Financials for this Owner
Home Financials are based on the most recent Mortgage that was taken out on this home.
Original Mortgage
$100,358
Interest Rate
7.82%
Mortgage Type
FHA
Create a Home Valuation Report for This Property
The Home Valuation Report is an in-depth analysis detailing your home's value as well as a comparison with similar homes in the area
Home Values in the Area
Average Home Value in this Area
Purchase History
| Date | Buyer | Sale Price | Title Company |
|---|---|---|---|
| Biggars Billy R | -- | Atc | |
| Robinson Clifton H | -- | Providence Title | |
| Robinson Clifton H | -- | None Available | |
| Cota Holly M | -- | Southwest Land Title |
Source: Public Records
Mortgage History
| Date | Status | Borrower | Loan Amount |
|---|---|---|---|
| Open | Biggars Billy R | $165,938 | |
| Previous Owner | Cota Holly M | $100,358 |
Source: Public Records
Tax History
| Year | Tax Paid | Tax Assessment Tax Assessment Total Assessment is a certain percentage of the fair market value that is determined by local assessors to be the total taxable value of land and additions on the property. | Land | Improvement |
|---|---|---|---|---|
| 2025 | $6,415 | $329,483 | $65,000 | $264,483 |
| 2024 | $6,415 | $329,483 | $65,000 | $264,483 |
| 2023 | $6,971 | $363,431 | $45,000 | $318,431 |
| 2022 | $5,833 | $267,042 | $45,000 | $222,042 |
| 2021 | $5,776 | $245,202 | $45,000 | $200,202 |
| 2020 | $5,080 | $213,655 | $45,000 | $168,655 |
| 2019 | $5,190 | $213,655 | $45,000 | $168,655 |
| 2018 | $4,446 | $183,030 | $25,000 | $158,030 |
| 2017 | $3,929 | $162,419 | $25,000 | $137,419 |
| 2016 | $3,921 | $162,091 | $25,000 | $137,091 |
| 2015 | $3,415 | $156,600 | $24,000 | $132,600 |
| 2014 | $3,415 | $136,000 | $18,000 | $118,000 |
Source: Public Records
Map
Nearby Homes
- 1115 Middlebury Ln
- 2620 Britany Cir
- 2313 Gettysburg Place
- 1216 Princeton Place
- 2337 Dalewood Ln
- 1000 Sherwood Dr
- 2428 Chestnut Way
- 1116 Highpoint Rd
- 2009 Charleston Dr
- 1124 Sherwood Dr
- 804 Natchez Ave
- 2218 Christopher Ln
- 1916 Chattanooga Dr
- 2201 Greendale Ct
- 933 Charleston Ct
- 3532 Frazier Ct
- 1613 Trinity Ct
- 1825 Schumac Ln
- 1621 Lexington Place
- 1720 Schumac Ln
- 804 Warwick St
- 2301 Windsor Ct
- 808 Warwick St
- 2610 Amberton Place
- 2612 Amberton Place
- 2513 Pipeline Rd
- 2524 Sakeena Ct
- 2305 Windsor Ct
- 2608 Amberton Place
- 812 Warwick St
- 2300 Windsor Ct
- 2518 Sakeena Ct
- 2702 Amberton Place
- 2304 Windsor Ct
- 2516 Sakeena Ct
- 2309 Windsor Ct
- 816 Warwick St
- 1101 Middlebury Ln
- 1100 Chesapeake St
- 2530 Sakeena Ct
Your Personal Tour Guide
Ask me questions while you tour the home.