Estimated Value: $263,000 - $314,000
2
Beds
1
Bath
1,028
Sq Ft
$279/Sq Ft
Est. Value
About This Home
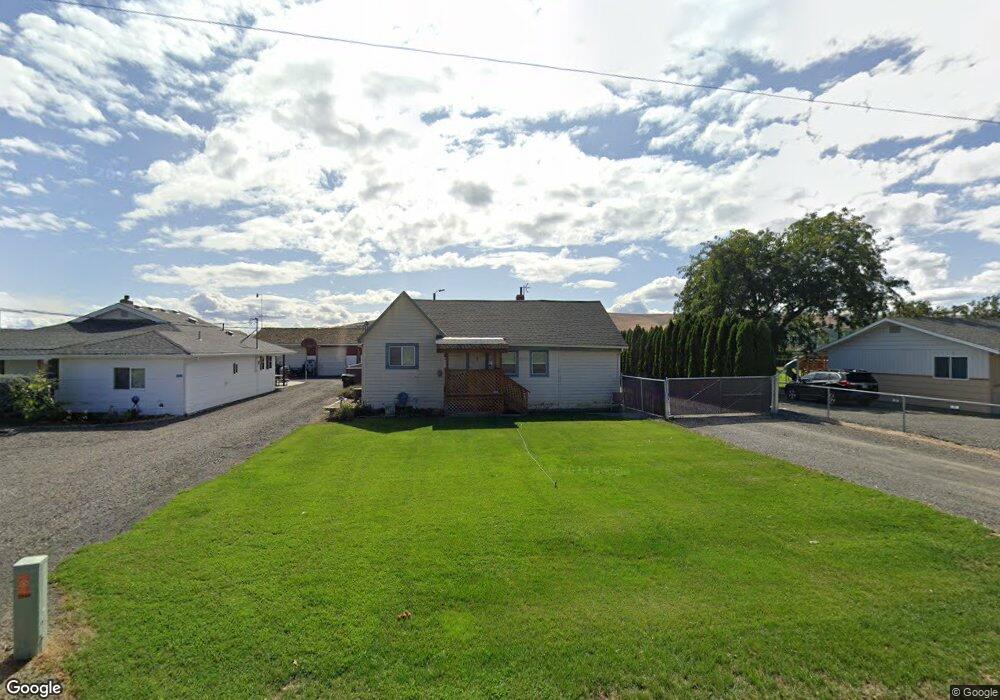
This home is located at 8000 Beauchene Rd, Moxee, WA 98936 and is currently estimated at $286,323, approximately $278 per square foot. 8000 Beauchene Rd is a home located in Yakima County with nearby schools including East Valley High School.
Ownership History
Date
Name
Owned For
Owner Type
Purchase Details
Closed on
Jun 12, 1998
Sold by
Matthews Sharon and Seguel Sharon
Bought by
Thomas Derek and Thomas Caroline M
Current Estimated Value
Home Financials for this Owner
Home Financials are based on the most recent Mortgage that was taken out on this home.
Original Mortgage
$63,500
Interest Rate
7.17%
Purchase Details
Closed on
Jun 9, 1998
Sold by
Bangs Sharon M and Bangs Clarence R
Bought by
Thomas Derek and Thomas Caroline M
Home Financials for this Owner
Home Financials are based on the most recent Mortgage that was taken out on this home.
Original Mortgage
$63,500
Interest Rate
7.17%
Purchase Details
Closed on
Sep 19, 1995
Sold by
Matthews Sharon and Seguel Sharon
Bought by
Thomas Derek and Thomas Caroline M
Home Financials for this Owner
Home Financials are based on the most recent Mortgage that was taken out on this home.
Original Mortgage
$72,000
Interest Rate
8.25%
Create a Home Valuation Report for This Property
The Home Valuation Report is an in-depth analysis detailing your home's value as well as a comparison with similar homes in the area
Home Values in the Area
Average Home Value in this Area
Purchase History
| Date | Buyer | Sale Price | Title Company |
|---|---|---|---|
| Thomas Derek | -- | Valley Title Guarantee | |
| Thomas Derek | -- | Valley Title Company | |
| Thomas Derek | $72,000 | Fidelity Title Company |
Source: Public Records
Mortgage History
| Date | Status | Borrower | Loan Amount |
|---|---|---|---|
| Closed | Thomas Derek | $63,500 | |
| Previous Owner | Thomas Derek | $72,000 |
Source: Public Records
Tax History Compared to Growth
Tax History
| Year | Tax Paid | Tax Assessment Tax Assessment Total Assessment is a certain percentage of the fair market value that is determined by local assessors to be the total taxable value of land and additions on the property. | Land | Improvement |
|---|---|---|---|---|
| 2025 | $2,762 | $252,300 | $62,600 | $189,700 |
| 2023 | $2,180 | $159,200 | $47,300 | $111,900 |
| 2022 | $1,977 | $145,100 | $46,300 | $98,800 |
| 2021 | $1,888 | $132,700 | $44,600 | $88,100 |
| 2019 | $1,633 | $113,700 | $44,600 | $69,100 |
| 2018 | $1,602 | $104,900 | $42,100 | $62,800 |
| 2017 | $1,384 | $94,500 | $30,000 | $64,500 |
| 2016 | $1,404 | $94,000 | $30,000 | $64,000 |
| 2015 | $1,404 | $94,900 | $30,000 | $64,900 |
| 2014 | $1,404 | $95,800 | $30,000 | $65,800 |
| 2013 | $1,404 | $95,800 | $30,000 | $65,800 |
Source: Public Records
Map
Nearby Homes
- 205 W Seattle Ave
- 112 & 118 W Moxee Ave
- NKA Rivard Rd
- 102 Rainier Ave
- 7800 Postma Rd
- 103 Lenseigne Place
- 612 Millenium Ave
- 108 Darland Ave
- 207 Clemans Ave
- 519 Lacoursiere St
- 2206 Porter Loop
- 2121 Amber Loop
- 505 Faucher Rd
- NKA Postma Rd
- NKA High Point Landing
- 3508 Birchfield Rd
- NKA Birchfield Rd
- NKA Riverside Rd
- 1803 Riverside Rd
- 2000 Konnowac Pass Rd
- 8002 Beauchene Rd
- 7910 Beauchene Rd
- 8006 Beauchene Rd
- 8008 Beauchene Rd
- 8005 Beauchene Rd
- 3303 La Framboise Rd
- 3307 La Framboise Rd
- 8102 Beauchene Rd
- 3212 La Framboise Rd
- 3333 La Framboise Rd
- 8108 Beauchene Rd
- 8209 Beauchene Rd
- 8211 Beauchene Rd
- 3408 La Framboise Rd
- 3112 La Framboise Rd
- 8401 Beauchene Rd
- 3511 La Framboise Rd
- 3101 La Framboise Rd
- 8502 Beauchene Rd
- NKA La Framboise Rd