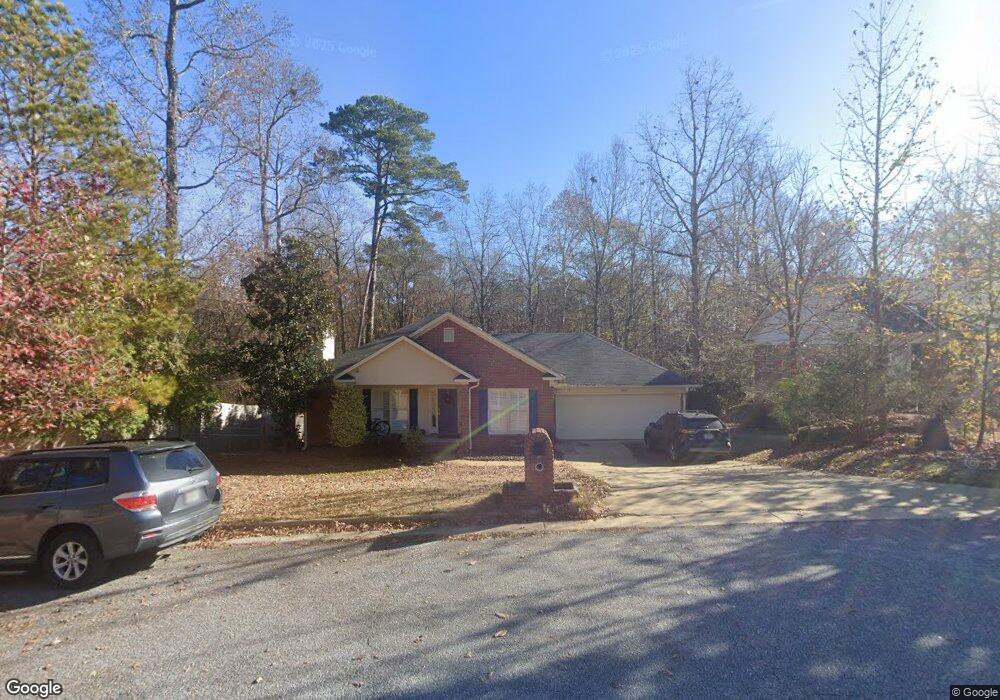
8000 Lagoon Ct Columbus, GA 31904
Northern Columbus NeighborhoodEstimated Value: $272,328 - $363,000
4
Beds
3
Baths
2,533
Sq Ft
$125/Sq Ft
Est. Value
About This Home
This home is located at 8000 Lagoon Ct, Columbus, GA 31904 and is currently estimated at $315,832, approximately $124 per square foot. 8000 Lagoon Ct is a home located in Muscogee County with nearby schools including Double Churches Elementary School, Double Churches Middle School, and Northside High School.
Ownership History
Date
Name
Owned For
Owner Type
Purchase Details
Closed on
Aug 28, 2020
Sold by
Robertson Jason
Bought by
Flegel Quinton and Flegel Stephne
Current Estimated Value
Home Financials for this Owner
Home Financials are based on the most recent Mortgage that was taken out on this home.
Original Mortgage
$239,900
Outstanding Balance
$212,895
Interest Rate
2.9%
Mortgage Type
VA
Estimated Equity
$102,937
Purchase Details
Closed on
May 31, 2018
Sold by
Hutchins David Brent
Bought by
Robertson Jason and Robertson Jennifer
Home Financials for this Owner
Home Financials are based on the most recent Mortgage that was taken out on this home.
Original Mortgage
$229,735
Interest Rate
4.5%
Mortgage Type
VA
Purchase Details
Closed on
Oct 5, 2015
Sold by
Hutchins Ivette Diane
Bought by
Hutchins David Brent
Create a Home Valuation Report for This Property
The Home Valuation Report is an in-depth analysis detailing your home's value as well as a comparison with similar homes in the area
Home Values in the Area
Average Home Value in this Area
Purchase History
| Date | Buyer | Sale Price | Title Company |
|---|---|---|---|
| Flegel Quinton | $239,900 | -- | |
| Robertson Jason | $224,900 | -- | |
| Hutchins David Brent | -- | -- |
Source: Public Records
Mortgage History
| Date | Status | Borrower | Loan Amount |
|---|---|---|---|
| Open | Flegel Quinton | $239,900 | |
| Previous Owner | Robertson Jason | $229,735 |
Source: Public Records
Tax History Compared to Growth
Tax History
| Year | Tax Paid | Tax Assessment Tax Assessment Total Assessment is a certain percentage of the fair market value that is determined by local assessors to be the total taxable value of land and additions on the property. | Land | Improvement |
|---|---|---|---|---|
| 2025 | $4,181 | $106,800 | $11,116 | $95,684 |
| 2024 | $4,181 | $106,800 | $11,116 | $95,684 |
| 2023 | $4,207 | $106,800 | $11,116 | $95,684 |
| 2022 | $3,858 | $94,488 | $11,116 | $83,372 |
| 2021 | $3,876 | $94,924 | $11,116 | $83,808 |
| 2020 | $3,274 | $80,176 | $11,116 | $69,060 |
| 2019 | $3,285 | $80,176 | $11,116 | $69,060 |
| 2018 | $2,738 | $80,176 | $11,116 | $69,060 |
| 2017 | $3,295 | $80,176 | $11,116 | $69,060 |
| 2016 | $3,793 | $91,952 | $8,800 | $83,152 |
| 2015 | $3,798 | $91,952 | $8,800 | $83,152 |
| 2014 | $3,802 | $91,952 | $8,800 | $83,152 |
| 2013 | -- | $91,952 | $8,800 | $83,152 |
Source: Public Records
Map
Nearby Homes
- 8008 Lagoon Ct
- 7313 Sesame St
- 7185 Helen Dr
- 7407 Peppercorn Dr
- 1719 Double Churches Rd
- 7131 Whitesville Rd
- 1438 Grove Park Dr Unit 13B
- 7995 Big Creek Place
- 18 Peppertree Ct
- 6810 Fawndale Dr
- 1355 Cloverdale Rd
- 6817 Whitesville Rd
- 6825 Ellis Dr
- 6802 Ellis Dr
- 7559 Crescent Dr
- 1440 Blanchfield Dr
- 6836 Sharmel Ln
- 1255 Woodville Ct
- 1049 Red Maple Way
- 6969 Mobley Rd
- 8004 Lagoon Ct
- 7037 Buckhorn Dr
- 8007 Lagoon Ct
- 8012 Lagoon Ct
- 7230 Easy St
- 7025 Buckhorn Dr
- 7018 Buckhorn Dr
- 8011 Lagoon Ct
- 8018 Lagoon Ct
- 8015 Lagoon Ct
- 7019 Buckhorn Dr
- 7006 Buckhorn Dr
- 7232 Easy St
- 8019 Lagoon Ct
- 8022 Lagoon Ct
- 7013 Buckhorn Dr
- 7240 Easy St
- 6994 Buckhorn Dr
- 7316 Easy St
- 7007 Buckhorn Dr