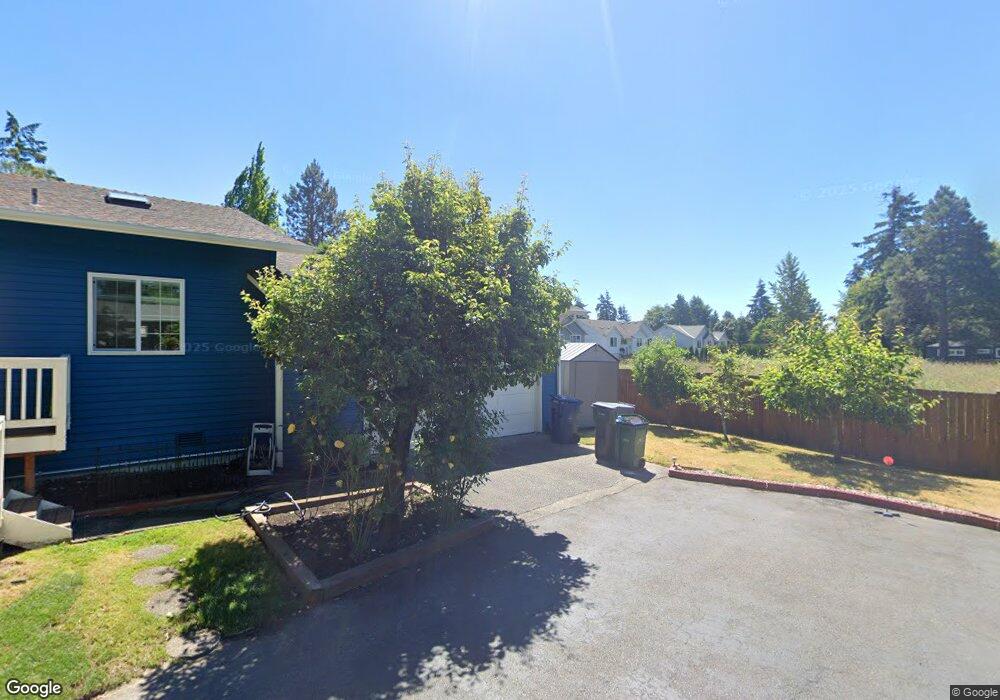
8001 NE 145th St Bothell, WA 98011
Finn Hill NeighborhoodEstimated Value: $1,018,000 - $1,086,000
3
Beds
2
Baths
1,100
Sq Ft
$956/Sq Ft
Est. Value
About This Home
This home is located at 8001 NE 145th St, Bothell, WA 98011 and is currently estimated at $1,051,365, approximately $955 per square foot. 8001 NE 145th St is a home located in King County with nearby schools including Henry David Thoreau Elementary School, Finn Hill Middle School, and Juanita High School.
Ownership History
Date
Name
Owned For
Owner Type
Purchase Details
Closed on
Feb 23, 2025
Sold by
Mandal Subhaditya and Mandal Guncha
Bought by
Fu Chuyong and Wang Jun
Current Estimated Value
Home Financials for this Owner
Home Financials are based on the most recent Mortgage that was taken out on this home.
Original Mortgage
$793,500
Outstanding Balance
$789,486
Interest Rate
6.93%
Mortgage Type
New Conventional
Estimated Equity
$261,879
Purchase Details
Closed on
Mar 5, 2015
Sold by
Thompson Jordan J and Thompson Linda D
Bought by
Mandal Subhaditya and Mandal Guncha
Home Financials for this Owner
Home Financials are based on the most recent Mortgage that was taken out on this home.
Original Mortgage
$371,250
Interest Rate
3.54%
Mortgage Type
New Conventional
Purchase Details
Closed on
May 24, 1988
Sold by
Glaser Nelson J
Bought by
Thompson Jordan J and Thompson Linda D
Create a Home Valuation Report for This Property
The Home Valuation Report is an in-depth analysis detailing your home's value as well as a comparison with similar homes in the area
Home Values in the Area
Average Home Value in this Area
Purchase History
| Date | Buyer | Sale Price | Title Company |
|---|---|---|---|
| Fu Chuyong | $1,058,000 | Ticor Title | |
| Mandal Subhaditya | $412,500 | Fidelity Natio | |
| Thompson Jordan J | $87,500 | -- |
Source: Public Records
Mortgage History
| Date | Status | Borrower | Loan Amount |
|---|---|---|---|
| Open | Fu Chuyong | $793,500 | |
| Previous Owner | Mandal Subhaditya | $371,250 |
Source: Public Records
Tax History Compared to Growth
Tax History
| Year | Tax Paid | Tax Assessment Tax Assessment Total Assessment is a certain percentage of the fair market value that is determined by local assessors to be the total taxable value of land and additions on the property. | Land | Improvement |
|---|---|---|---|---|
| 2024 | $7,018 | $846,000 | $495,000 | $351,000 |
| 2023 | $6,357 | $725,000 | $404,000 | $321,000 |
| 2022 | $6,019 | $908,000 | $481,000 | $427,000 |
| 2021 | $5,566 | $662,000 | $350,000 | $312,000 |
| 2020 | $5,434 | $558,000 | $290,000 | $268,000 |
| 2018 | $4,361 | $463,000 | $266,000 | $197,000 |
| 2017 | $3,971 | $413,000 | $237,000 | $176,000 |
| 2016 | $3,817 | $391,000 | $224,000 | $167,000 |
| 2015 | $3,665 | $370,000 | $213,000 | $157,000 |
| 2014 | -- | $342,000 | $194,000 | $148,000 |
| 2013 | -- | $281,000 | $160,000 | $121,000 |
Source: Public Records
Map
Nearby Homes
- 8031 NE 145th St
- 8254 NE 143rd Place
- 14911 84th Ave NE
- 14808 84th Ave NE
- 7419 NE 145th St
- 7728 NE 151st Ln
- 15031 78th Ave NE
- 15115 78th Ave NE
- 7328 NE 142nd Place Unit 5D
- 7802 NE 140th Place
- 14132 74th Place NE Unit 16D
- 8746 NE 144th Ct
- 15505 81st Ave NE
- 14933 73rd Ave NE
- 16 Xxx 76th Place NE
- 7609 NE 155th St
- 14711 70th Ct NE
- 14020 Juanita Dr NE Unit B3
- 8407 NE 156th St
- 8401 NE 156th St
- 8003 NE 145th St
- 14338 79th Place NE
- 14402 79th Place NE
- 8019 NE 145th St
- 14402 79th Place NE
- 8010 NE 143rd St
- 8010 NE 143rd St
- 14328 79th Place NE
- 8017 NE 145th St
- 14408 79th Place NE
- 14408 79th Place NE
- 14419 81st Ave NE
- 8013 NE 145th St
- 8005 NE 145th St
- 14320 79th Place NE
- 8012 NE 143rd St
- 14329 81st Ct NE
- 8013 NE 145th St
- 14333 81st Ct NE
- 14333 81st Ct NE