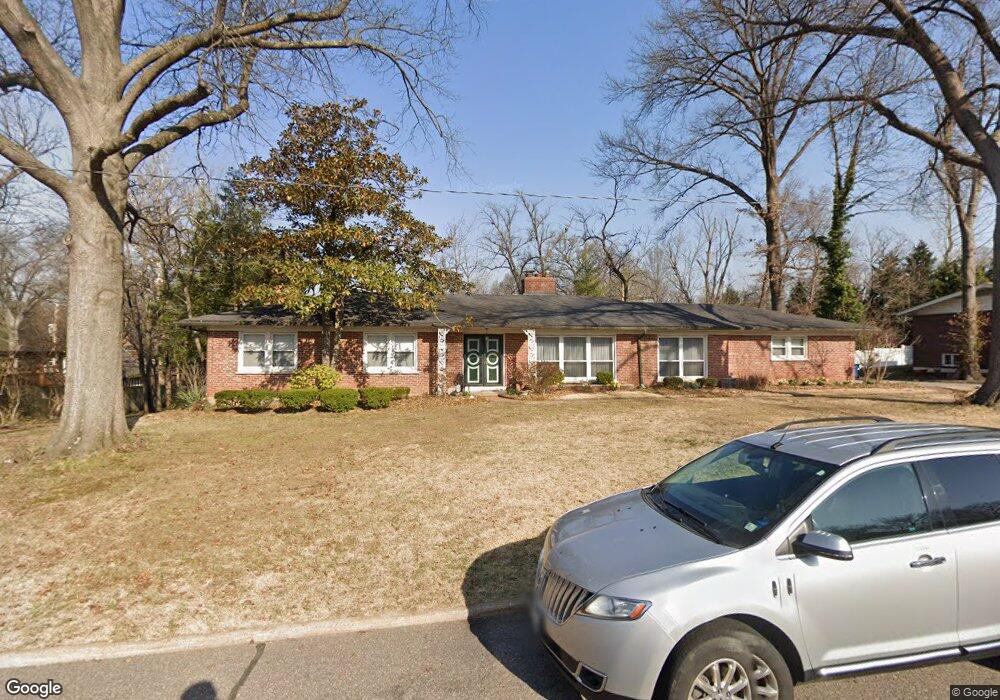
8003 Bennett Ave Saint Louis, MO 63117
Estimated Value: $472,000 - $610,000
3
Beds
2
Baths
1,869
Sq Ft
$276/Sq Ft
Est. Value
About This Home
This home is located at 8003 Bennett Ave, Saint Louis, MO 63117 and is currently estimated at $515,256, approximately $275 per square foot. 8003 Bennett Ave is a home located in St. Louis County with nearby schools including Maplewood Richmond Heights Elementary School, Maplewood Richmond Heights Middle School, and Maplewood-Richmond Heights High School.
Ownership History
Date
Name
Owned For
Owner Type
Purchase Details
Closed on
Mar 30, 2001
Sold by
Potts Colby A and Potts Kimberly A
Bought by
Mueller James T and Mueller Mary K
Current Estimated Value
Home Financials for this Owner
Home Financials are based on the most recent Mortgage that was taken out on this home.
Original Mortgage
$98,000
Interest Rate
6.61%
Purchase Details
Closed on
Dec 30, 1997
Sold by
Potts Kimberly A and Potts Colby A
Bought by
Potts Kimberly A and Potts Colby A
Purchase Details
Closed on
Nov 16, 1997
Sold by
Fultz Gussie Love Trust and White Edith
Bought by
Potts Kimberly A
Purchase Details
Closed on
Oct 23, 1997
Sold by
United Negro College Fund Inc
Bought by
Potts Kimberly A
Purchase Details
Closed on
Feb 1, 1995
Sold by
Love Fultz Gussie
Bought by
Fultz Gussie Love
Create a Home Valuation Report for This Property
The Home Valuation Report is an in-depth analysis detailing your home's value as well as a comparison with similar homes in the area
Home Values in the Area
Average Home Value in this Area
Purchase History
| Date | Buyer | Sale Price | Title Company |
|---|---|---|---|
| Mueller James T | $211,000 | Title Searches Inc | |
| Mueller James T | $211,000 | Title Searches Inc | |
| Potts Kimberly A | -- | -- | |
| Potts Kimberly A | -- | -- | |
| Potts Kimberly A | -- | -- | |
| Fultz Gussie Love | -- | -- |
Source: Public Records
Mortgage History
| Date | Status | Borrower | Loan Amount |
|---|---|---|---|
| Previous Owner | Mueller James T | $98,000 |
Source: Public Records
Tax History Compared to Growth
Tax History
| Year | Tax Paid | Tax Assessment Tax Assessment Total Assessment is a certain percentage of the fair market value that is determined by local assessors to be the total taxable value of land and additions on the property. | Land | Improvement |
|---|---|---|---|---|
| 2025 | $5,274 | $68,970 | $56,940 | $12,030 |
| 2024 | $5,274 | $68,970 | $37,280 | $31,690 |
| 2023 | $5,228 | $68,970 | $37,280 | $31,690 |
| 2022 | $4,678 | $57,000 | $37,280 | $19,720 |
| 2021 | $4,597 | $68,140 | $37,280 | $30,860 |
| 2020 | $4,789 | $56,340 | $27,590 | $28,750 |
| 2019 | $4,752 | $56,340 | $27,590 | $28,750 |
| 2018 | $4,769 | $51,320 | $18,890 | $32,430 |
| 2017 | $4,736 | $51,320 | $18,890 | $32,430 |
| 2016 | $4,101 | $42,810 | $16,990 | $25,820 |
| 2015 | $3,854 | $42,810 | $16,990 | $25,820 |
| 2014 | $3,379 | $37,540 | $9,040 | $28,500 |
Source: Public Records
Map
Nearby Homes
- 1250 Hampton Park Dr
- 1501 Stockard Ave
- 61 Lake Forest Dr
- 1510 Banneker Ave
- 7716 Lovella Ave
- 7735 Saint Albans Ave
- 7723 Dale Ave
- 7715 Dale Ave
- 1140 Hillside Dr
- 1262 Moorlands Dr
- 7742 Wise Ave
- 50 Lake Forest Dr
- 1129 Terrace Dr
- 7532 Cromwell Dr Unit 1S
- 7524 Cromwell Dr Unit 3PH
- 7501 Cromwell Dr Unit 1
- 7544 York Dr Unit 3W
- 7544 York Dr Unit 3E
- 7765 Weston Place
- 1060 E Linden Ave
- 8011 Bennett Ave
- 7925 Bennett Ave
- 8008 Bennett Ave
- 8048 South Dr
- 8000 Bennett Ave
- 8015 Bennett Ave
- 8012 Bennett Ave
- 8062 South Dr
- 8030 South Dr
- 8021 Bennett Ave
- 7924 Bennett Ave
- 7920 Bennett Ave
- 8020 Bennett Ave
- 7915 Bennett Ave
- 8027 Bennett Ave
- 8014 South Dr
- 1239 Laclede Station Rd
- 1251 Laclede Station Rd
- 1227 Laclede Station Rd
- 8049 South Dr