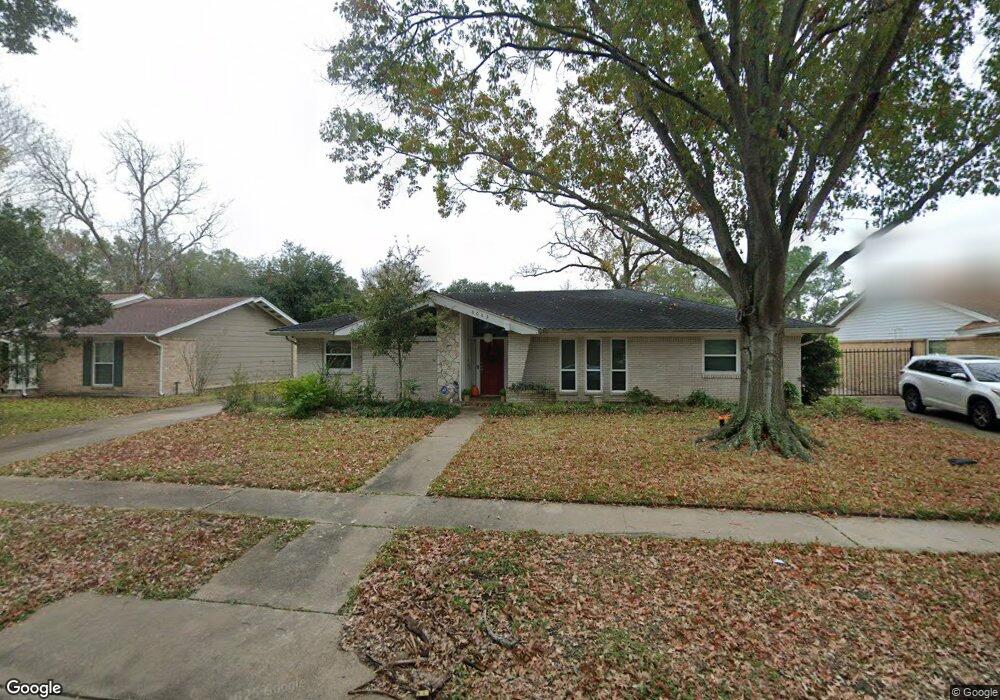
8003 Neff St Houston, TX 77036
Sharpstown NeighborhoodEstimated Value: $359,388 - $383,000
3
Beds
2
Baths
2,556
Sq Ft
$144/Sq Ft
Est. Value
About This Home
This home is located at 8003 Neff St, Houston, TX 77036 and is currently estimated at $367,347, approximately $143 per square foot. 8003 Neff St is a home located in Harris County with nearby schools including Neff Elementary School, Sugar Grove Academy, and Sharpstown High School.
Ownership History
Date
Name
Owned For
Owner Type
Purchase Details
Closed on
May 12, 2017
Sold by
Zari Investments Llc
Bought by
Ashmore Caleb Richard and Washmon Katelin Waller
Current Estimated Value
Home Financials for this Owner
Home Financials are based on the most recent Mortgage that was taken out on this home.
Original Mortgage
$220,800
Outstanding Balance
$149,983
Interest Rate
4.1%
Mortgage Type
New Conventional
Estimated Equity
$217,364
Purchase Details
Closed on
Nov 14, 2016
Sold by
Leach Kay M and Leach Katherine
Bought by
Zari Investments Llc
Purchase Details
Closed on
Jan 4, 1990
Sold by
Leach Marion D
Bought by
Leach Kay M
Create a Home Valuation Report for This Property
The Home Valuation Report is an in-depth analysis detailing your home's value as well as a comparison with similar homes in the area
Home Values in the Area
Average Home Value in this Area
Purchase History
| Date | Buyer | Sale Price | Title Company |
|---|---|---|---|
| Ashmore Caleb Richard | -- | None Available | |
| Zari Investments Llc | -- | None Available | |
| Leach Kay M | -- | -- |
Source: Public Records
Mortgage History
| Date | Status | Borrower | Loan Amount |
|---|---|---|---|
| Open | Ashmore Caleb Richard | $220,800 |
Source: Public Records
Tax History Compared to Growth
Tax History
| Year | Tax Paid | Tax Assessment Tax Assessment Total Assessment is a certain percentage of the fair market value that is determined by local assessors to be the total taxable value of land and additions on the property. | Land | Improvement |
|---|---|---|---|---|
| 2025 | $5,070 | $348,778 | $135,385 | $213,393 |
| 2024 | $5,070 | $354,150 | $97,778 | $256,372 |
| 2023 | $5,070 | $383,558 | $97,778 | $285,780 |
| 2022 | $7,176 | $314,481 | $60,171 | $254,310 |
| 2021 | $6,689 | $287,000 | $60,171 | $226,829 |
| 2020 | $6,854 | $274,004 | $60,171 | $213,833 |
| 2019 | $7,237 | $277,216 | $45,128 | $232,088 |
| 2018 | $5,311 | $275,900 | $45,128 | $230,772 |
| 2017 | $4,217 | $161,652 | $45,128 | $116,524 |
| 2016 | $3,351 | $157,466 | $45,128 | $112,338 |
| 2015 | $37 | $138,031 | $45,128 | $92,903 |
| 2014 | $37 | $119,247 | $45,128 | $74,119 |
Source: Public Records
Map
Nearby Homes
- 8019 Sharpview Dr
- 7819 Bellaire Blvd
- 8314 Edgemoor Dr
- 7419 Barberton Dr
- 8119 Concho St
- 8515 Edgemoor Dr
- 6602 Harbor Town Dr Unit 1207
- 6602 Harbor Town Dr Unit 1202
- 7302 Burning Tree Dr
- 8218 Hazen St
- 8530 Roos Rd
- 8527 Edgemoor Dr
- 6500 Harbor Town Dr Unit 3208
- 6500 Harbor Town Dr Unit 2808
- 6500 Harbor Town Dr Unit 3204
- 6500 Harbor Town Dr Unit 3408
- 6500 Harbor Town Dr Unit 2902
- 7302 Redding Rd
- 8223 Golf Green Cir
- 8418 Hazen St