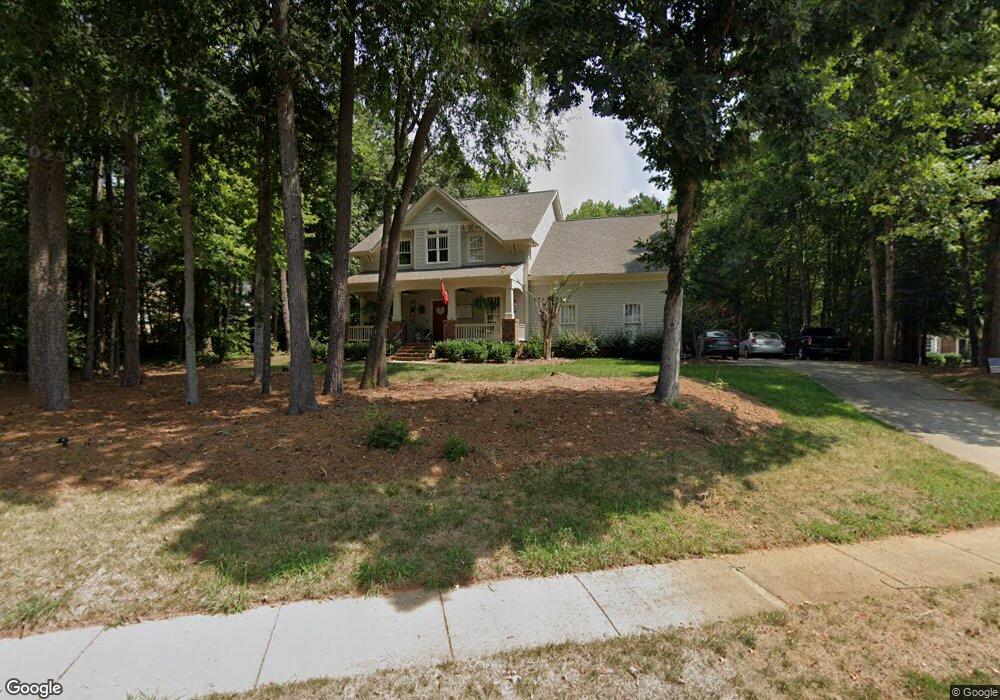
8003 Silver Jade Ln Denver, NC 28037
Estimated Value: $771,000 - $933,000
4
Beds
3
Baths
2,988
Sq Ft
$291/Sq Ft
Est. Value
About This Home
This home is located at 8003 Silver Jade Ln, Denver, NC 28037 and is currently estimated at $868,553, approximately $290 per square foot. 8003 Silver Jade Ln is a home located in Lincoln County with nearby schools including Rock Springs Elementary School, North Lincoln Middle School, and North Lincoln High School.
Ownership History
Date
Name
Owned For
Owner Type
Purchase Details
Closed on
May 21, 2019
Sold by
Rhodes James R
Bought by
Mccloskey Linda M and Mccloskey Sean
Current Estimated Value
Home Financials for this Owner
Home Financials are based on the most recent Mortgage that was taken out on this home.
Original Mortgage
$450,562
Outstanding Balance
$394,518
Interest Rate
4%
Mortgage Type
VA
Estimated Equity
$474,035
Purchase Details
Closed on
Sep 3, 2015
Sold by
Rhodes Inger G and Rhodes James R
Bought by
Rhodes James R
Home Financials for this Owner
Home Financials are based on the most recent Mortgage that was taken out on this home.
Original Mortgage
$376,000
Interest Rate
4.02%
Mortgage Type
New Conventional
Purchase Details
Closed on
Feb 27, 2006
Sold by
Rhodes James R
Bought by
Rhodes Inger G
Purchase Details
Closed on
Apr 30, 1999
Bought by
Rhodes James R and Rhodes Inger G
Purchase Details
Closed on
Aug 28, 1998
Bought by
Saussy Burbank Inc
Create a Home Valuation Report for This Property
The Home Valuation Report is an in-depth analysis detailing your home's value as well as a comparison with similar homes in the area
Home Values in the Area
Average Home Value in this Area
Purchase History
| Date | Buyer | Sale Price | Title Company |
|---|---|---|---|
| Mccloskey Linda M | $495,000 | Title Company Of Nc | |
| Rhodes James R | -- | American Home Title Llc | |
| Rhodes Inger G | -- | None Available | |
| Rhodes James R | $276,000 | -- | |
| Saussy Burbank Inc | $36,500 | -- |
Source: Public Records
Mortgage History
| Date | Status | Borrower | Loan Amount |
|---|---|---|---|
| Open | Mccloskey Linda M | $450,562 | |
| Previous Owner | Rhodes James R | $376,000 |
Source: Public Records
Tax History Compared to Growth
Tax History
| Year | Tax Paid | Tax Assessment Tax Assessment Total Assessment is a certain percentage of the fair market value that is determined by local assessors to be the total taxable value of land and additions on the property. | Land | Improvement |
|---|---|---|---|---|
| 2025 | $4,534 | $726,313 | $102,000 | $624,313 |
| 2024 | $4,500 | $726,313 | $102,000 | $624,313 |
| 2023 | $4,495 | $726,313 | $102,000 | $624,313 |
| 2022 | $3,331 | $434,011 | $70,000 | $364,011 |
| 2021 | $3,301 | $431,536 | $70,000 | $361,536 |
| 2020 | $3,081 | $431,536 | $70,000 | $361,536 |
| 2019 | $3,081 | $431,536 | $70,000 | $361,536 |
| 2018 | $2,795 | $371,121 | $74,000 | $297,121 |
| 2017 | $2,694 | $371,121 | $74,000 | $297,121 |
| 2016 | $2,685 | $371,121 | $74,000 | $297,121 |
| 2015 | $2,836 | $371,121 | $74,000 | $297,121 |
| 2014 | $3,093 | $413,635 | $86,000 | $327,635 |
Source: Public Records
Map
Nearby Homes
- 8026 Silver Jade Dr
- 00 Hawkes Bay Ct Unit 121
- 4218 Ash Hollow Ln
- 7909 Bay Pointe Dr
- 8065 Bay Pointe Dr
- 7722 Juniper Ln
- 7464 Albemarle Dr
- 7962 Westcape Dr Unit 1016
- #19 Juniper Ln
- 7656 Juniper Ln Unit 15
- 7653 Juniper Ln
- 44 Cottonwood Dr
- 3995 Burton Ln
- 4018 Halyard Dr
- 4017 Halyard Dr
- 4548 Stonesthrow Dr
- 4237 Little Fork Cove Rd
- 7717 Nautical View
- 512 Stonemarker Rd
- 0000 Spindrift Cove Unit 59
- 8003 Silver Jade Ln Unit 28
- 8017 Silver Jade Ln
- 7896 Buena Vista Dr
- Lot 30 Buena Vista Dr Unit Lot 30
- 8010 Silver Jade Ln
- 7906 Buena Vista Dr
- 7906 Buena Vista Dr Unit 32
- 8022 Silver Jade Dr Unit 21
- 7872 Buena Vista Dr
- 8027 Silver Jade Ln
- 8022 Silver Jade Ln
- 7916 Buena Vista Dr
- 7994 Silver Jade Ln
- Lot 22 Silver Jade Dr
- Lot 22 Silver Jade Dr Unit 22
- 4484 Rippling Cove Ct
- Lot126 Buena Vista Dr
- Lot126 Buena Vista Dr Unit 126
- 7926 Buena Vista Dr
- LOT 37 Rippling Cove Ct