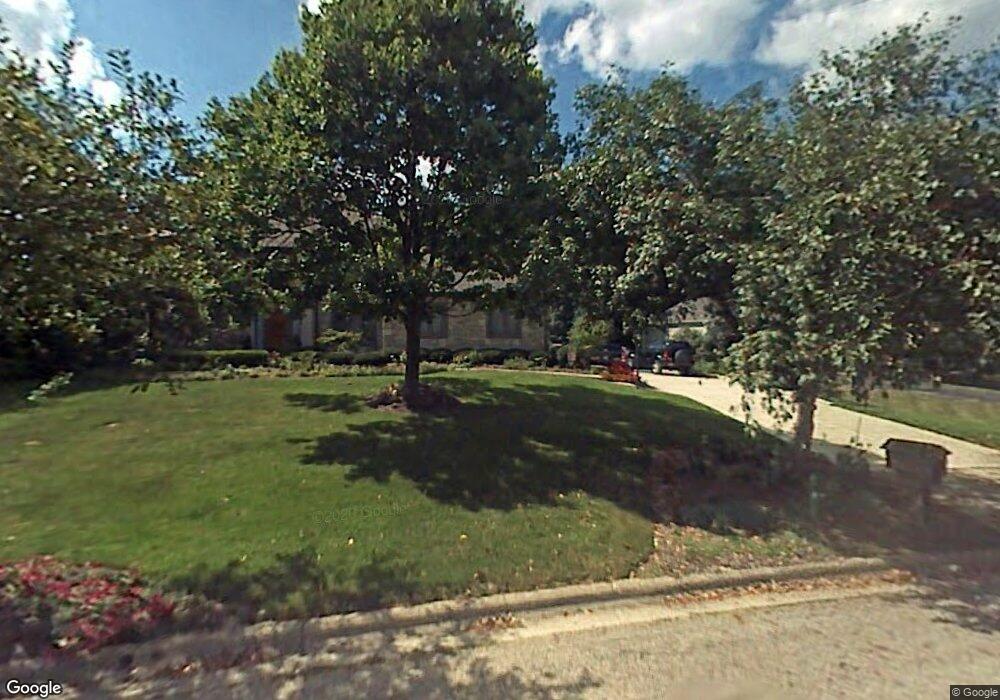
8003 Tipperary Ct N Dublin, OH 43017
Estimated Value: $733,337 - $782,000
5
Beds
4
Baths
3,424
Sq Ft
$223/Sq Ft
Est. Value
About This Home
This home is located at 8003 Tipperary Ct N, Dublin, OH 43017 and is currently estimated at $764,334, approximately $223 per square foot. 8003 Tipperary Ct N is a home located in Franklin County with nearby schools including Mary Emma Bailey Elementary School, John Sells Middle School, and Dublin Coffman High School.
Ownership History
Date
Name
Owned For
Owner Type
Purchase Details
Closed on
Feb 15, 2006
Sold by
Stewart Heather M and Stewart Jeffrey L
Bought by
Clement Deborah L and Saxe Harry W
Current Estimated Value
Home Financials for this Owner
Home Financials are based on the most recent Mortgage that was taken out on this home.
Original Mortgage
$327,840
Outstanding Balance
$180,311
Interest Rate
6.2%
Mortgage Type
Fannie Mae Freddie Mac
Estimated Equity
$584,023
Purchase Details
Closed on
Feb 4, 2003
Sold by
Stewart Heather M and Stewart Jeffrey L
Bought by
Stewart Heather M and Stewart Jeffrey L
Home Financials for this Owner
Home Financials are based on the most recent Mortgage that was taken out on this home.
Original Mortgage
$200,000
Interest Rate
6.01%
Purchase Details
Closed on
Sep 16, 1993
Bought by
Stewart Jeffrey L
Purchase Details
Closed on
Jun 20, 1990
Purchase Details
Closed on
Mar 1, 1985
Create a Home Valuation Report for This Property
The Home Valuation Report is an in-depth analysis detailing your home's value as well as a comparison with similar homes in the area
Home Values in the Area
Average Home Value in this Area
Purchase History
| Date | Buyer | Sale Price | Title Company |
|---|---|---|---|
| Clement Deborah L | $409,800 | None Available | |
| Stewart Heather M | -- | -- | |
| Stewart Jeffrey L | -- | -- | |
| -- | $227,500 | -- | |
| -- | $220,500 | -- |
Source: Public Records
Mortgage History
| Date | Status | Borrower | Loan Amount |
|---|---|---|---|
| Open | Clement Deborah L | $327,840 | |
| Closed | Stewart Heather M | $200,000 |
Source: Public Records
Tax History
| Year | Tax Paid | Tax Assessment Tax Assessment Total Assessment is a certain percentage of the fair market value that is determined by local assessors to be the total taxable value of land and additions on the property. | Land | Improvement |
|---|---|---|---|---|
| 2025 | $14,892 | $229,220 | $52,500 | $176,720 |
| 2024 | $14,892 | $229,220 | $52,500 | $176,720 |
| 2023 | $14,686 | $229,215 | $52,500 | $176,715 |
| 2022 | $12,205 | $174,130 | $28,880 | $145,250 |
| 2021 | $12,235 | $174,130 | $28,880 | $145,250 |
| 2020 | $12,336 | $174,130 | $28,880 | $145,250 |
| 2019 | $12,621 | $157,570 | $26,250 | $131,320 |
| 2018 | $12,621 | $157,570 | $26,250 | $131,320 |
| 2017 | $11,746 | $157,570 | $26,250 | $131,320 |
| 2016 | $12,485 | $157,260 | $29,160 | $128,100 |
| 2015 | $12,566 | $157,260 | $29,160 | $128,100 |
| 2014 | $12,581 | $157,260 | $29,160 | $128,100 |
| 2013 | $6,097 | $149,765 | $27,755 | $122,010 |
Source: Public Records
Map
Nearby Homes
- 4977 Dunkerrin Ct
- 7846 Tipperary Ct S
- 4650 Chatham Ct
- 4545 Dunleary Dr
- 4514 Dunleary Dr
- 7830 Windwood Dr
- 7580 Bellaire Ave
- 7785 Kate Brown Dr
- 5250 Indian Hill Rd
- 7487 Balfoure Cir
- 10900 Buckingham Place
- 7575 Riverside Dr
- 5170 Reddington Dr
- 5202 Reddington Dr
- 5314 Hawthornden Ct
- 7440 Wellington Reserve Ct
- 5119 Reserve Dr
- 10669 Riverside Dr
- 10618 Riverside Dr
- 4740 Bright Rd
- 7985 Tipperary Ct N
- 8017 Tipperary Ct N
- 7984 Tipperary Ct N
- 7967 Tipperary Ct N
- 4762 MacAllan Ct E
- 4770 MacAllan Ct E
- 8008 Tipperary Ct N
- 8027 Tipperary Ct N
- 4820 Galway Dr
- 8020 Tipperary Ct N
- 8038 Tipperary Ct N
- 4769 MacAllan Ct E
- 7949 Tipperary Ct N
- 4804 Galway Dr
- 8028 Tipperary Ct N
- 4778 MacAllan Ct E
- 4899 Donegal Cliffs Dr
- 4879 Donegal Cliffs Dr
- 4848 Galway Dr
- 4915 Donegal Cliffs Dr
Your Personal Tour Guide
Ask me questions while you tour the home.