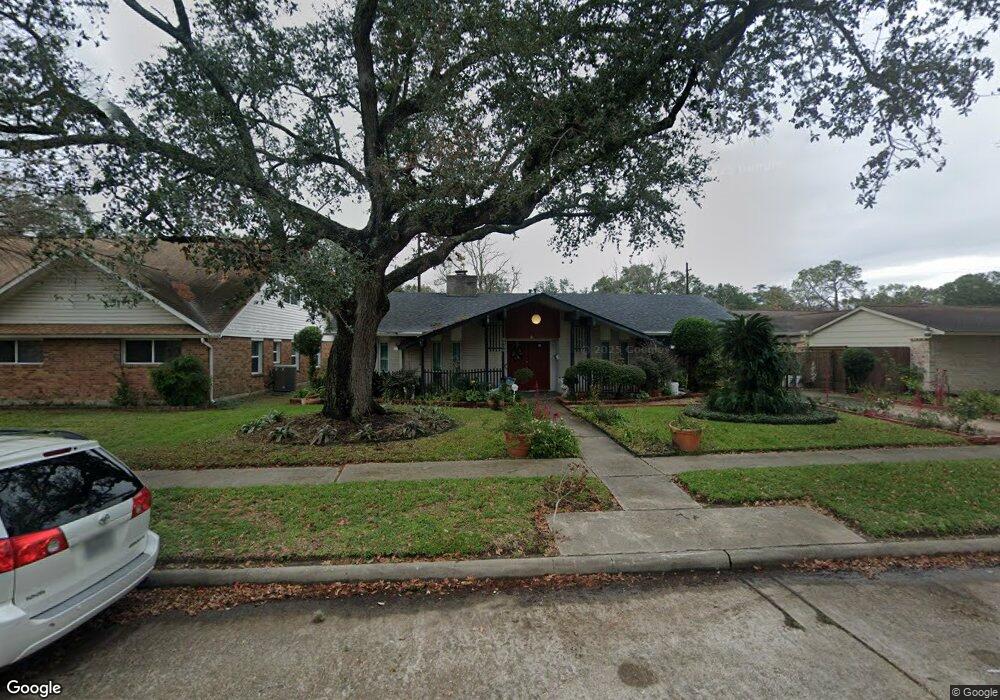
8006 Neff St Houston, TX 77036
Sharpstown NeighborhoodEstimated Value: $353,000 - $394,000
3
Beds
2
Baths
2,833
Sq Ft
$132/Sq Ft
Est. Value
About This Home
This home is located at 8006 Neff St, Houston, TX 77036 and is currently estimated at $374,076, approximately $132 per square foot. 8006 Neff St is a home located in Harris County with nearby schools including Neff Elementary School, Sugar Grove Academy, and Sharpstown High School.
Ownership History
Date
Name
Owned For
Owner Type
Purchase Details
Closed on
Jul 2, 2024
Sold by
Shaikh Evelyn Bacani
Bought by
Evelyn Bacani Shaikh Trust and Shaikh
Current Estimated Value
Purchase Details
Closed on
Feb 27, 2002
Sold by
The John & Mary Corder Family Ltd Partne
Bought by
Shaikh Mushtaq
Home Financials for this Owner
Home Financials are based on the most recent Mortgage that was taken out on this home.
Original Mortgage
$100,000
Interest Rate
6.93%
Mortgage Type
Seller Take Back
Purchase Details
Closed on
Mar 9, 1998
Sold by
Sanford David E and Sanford Susan
Bought by
Shaikh Evelyn
Purchase Details
Closed on
Feb 12, 1996
Sold by
Shaikh Mushtaq
Bought by
Shaikh Evelyn B
Purchase Details
Closed on
Oct 20, 1994
Sold by
Umbach Clayton A and Umbach Patricia Y
Bought by
Shaikh Evelyn B and Shaikh Mushtaq A
Create a Home Valuation Report for This Property
The Home Valuation Report is an in-depth analysis detailing your home's value as well as a comparison with similar homes in the area
Home Values in the Area
Average Home Value in this Area
Purchase History
| Date | Buyer | Sale Price | Title Company |
|---|---|---|---|
| Evelyn Bacani Shaikh Trust | -- | None Listed On Document | |
| Shaikh Mushtaq | -- | -- | |
| Shaikh Mushtaq | -- | -- | |
| Shaikh Evelyn | -- | Texas American Title Company | |
| Shaikh Evelyn B | -- | -- | |
| Shaikh Evelyn B | -- | -- | |
| Shaikh Evelyn B | -- | Texas American Title Company |
Source: Public Records
Mortgage History
| Date | Status | Borrower | Loan Amount |
|---|---|---|---|
| Previous Owner | Shaikh Mushtaq | $100,000 | |
| Previous Owner | Shaikh Mushtaq | $250,000 |
Source: Public Records
Tax History Compared to Growth
Tax History
| Year | Tax Paid | Tax Assessment Tax Assessment Total Assessment is a certain percentage of the fair market value that is determined by local assessors to be the total taxable value of land and additions on the property. | Land | Improvement |
|---|---|---|---|---|
| 2025 | $430 | $357,760 | $136,042 | $221,718 |
| 2024 | $430 | $357,760 | $98,253 | $259,507 |
| 2023 | $430 | $357,760 | $98,253 | $259,507 |
| 2022 | $6,782 | $335,283 | $60,463 | $274,820 |
| 2021 | $6,298 | $270,206 | $60,463 | $209,743 |
| 2020 | $7,103 | $283,945 | $60,463 | $223,482 |
| 2019 | $7,531 | $289,360 | $45,347 | $244,013 |
| 2018 | $2,134 | $276,842 | $45,347 | $231,495 |
| 2017 | $6,220 | $269,973 | $45,347 | $224,626 |
| 2016 | $5,654 | $258,790 | $45,347 | $213,443 |
| 2015 | $3,524 | $230,762 | $45,347 | $185,415 |
| 2014 | $3,524 | $199,689 | $45,347 | $154,342 |
Source: Public Records
Map
Nearby Homes
- 7819 Bellaire Blvd
- 8019 Sharpview Dr
- 8314 Edgemoor Dr
- 7419 Barberton Dr
- 6602 Harbor Town Dr Unit 1207
- 6602 Harbor Town Dr Unit 1202
- 8515 Edgemoor Dr
- 8119 Concho St
- 8527 Edgemoor Dr
- 7302 Burning Tree Dr
- 8530 Roos Rd
- 6500 Harbor Town Dr Unit 3208
- 6500 Harbor Town Dr Unit 2808
- 6500 Harbor Town Dr Unit 3204
- 6500 Harbor Town Dr Unit 3408
- 6500 Harbor Town Dr Unit 2902
- 8218 Hazen St
- 7302 Redding Rd
- 8223 Golf Green Cir
- 6403 Fondren Rd Unit D25