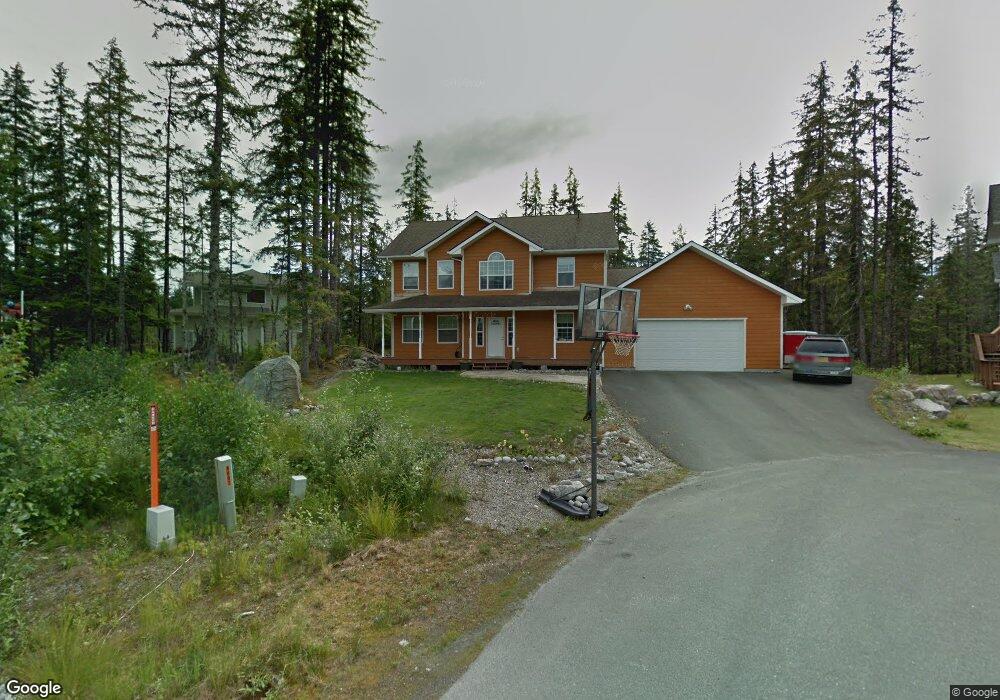
8007 Magnolia Ct Juneau, AK 99801
Back Loop NeighborhoodEstimated Value: $770,000 - $974,000
4
Beds
2
Baths
2,783
Sq Ft
$305/Sq Ft
Est. Value
About This Home
This home is located at 8007 Magnolia Ct, Juneau, AK 99801 and is currently estimated at $848,106, approximately $304 per square foot. 8007 Magnolia Ct is a home located in Juneau City and Borough with nearby schools including Auke Bay Elementary School.
Ownership History
Date
Name
Owned For
Owner Type
Purchase Details
Closed on
Mar 15, 2016
Sold by
Boyer Jason A and Boyer Mary R
Bought by
White Stephen
Current Estimated Value
Home Financials for this Owner
Home Financials are based on the most recent Mortgage that was taken out on this home.
Original Mortgage
$499,481
Outstanding Balance
$396,254
Interest Rate
3.72%
Mortgage Type
VA
Estimated Equity
$451,852
Purchase Details
Closed on
Jul 2, 2012
Sold by
Lyons Nicholas C and Yurman Kathy F
Bought by
Boyer Jason A and Boyer Mary R
Home Financials for this Owner
Home Financials are based on the most recent Mortgage that was taken out on this home.
Original Mortgage
$511,335
Interest Rate
3.74%
Mortgage Type
VA
Purchase Details
Closed on
Oct 11, 2004
Sold by
Montana Creek Development Inc
Bought by
Paul Shawn C
Home Financials for this Owner
Home Financials are based on the most recent Mortgage that was taken out on this home.
Original Mortgage
$469,300
Interest Rate
5.77%
Mortgage Type
Purchase Money Mortgage
Create a Home Valuation Report for This Property
The Home Valuation Report is an in-depth analysis detailing your home's value as well as a comparison with similar homes in the area
Home Values in the Area
Average Home Value in this Area
Purchase History
| Date | Buyer | Sale Price | Title Company |
|---|---|---|---|
| White Stephen | -- | Aetia | |
| Boyer Jason A | -- | None Available | |
| Paul Shawn C | -- | -- |
Source: Public Records
Mortgage History
| Date | Status | Borrower | Loan Amount |
|---|---|---|---|
| Open | White Stephen | $499,481 | |
| Previous Owner | Boyer Jason A | $511,335 | |
| Previous Owner | Paul Shawn C | $469,300 |
Source: Public Records
Tax History Compared to Growth
Tax History
| Year | Tax Paid | Tax Assessment Tax Assessment Total Assessment is a certain percentage of the fair market value that is determined by local assessors to be the total taxable value of land and additions on the property. | Land | Improvement |
|---|---|---|---|---|
| 2025 | $6,052 | $741,000 | $148,900 | $592,100 |
| 2024 | $6,274 | $774,900 | $148,900 | $626,000 |
| 2023 | $6,202 | $760,400 | $148,900 | $611,500 |
| 2022 | $6,584 | $623,500 | $143,300 | $480,200 |
| 2021 | $6,087 | $576,400 | $143,300 | $433,100 |
| 2020 | $6,014 | $564,200 | $143,300 | $420,900 |
| 2019 | $5,868 | $550,500 | $143,300 | $407,200 |
| 2018 | $6,069 | $555,100 | $151,000 | $404,100 |
| 2017 | $6,069 | $575,055 | $176,376 | $398,679 |
| 2016 | $6,069 | $569,362 | $174,630 | $394,732 |
| 2015 | -- | $537,134 | $164,745 | $372,389 |
| 2014 | -- | $533,400 | $163,600 | $369,800 |
Source: Public Records
Map
Nearby Homes
- 1023 Arctic Cir
- 9990 Mendenhall Loop Rd
- 4920 Steelhead St
- 4401 Riverside Dr Unit B-1
- 4401 Riverside Dr Unit B4
- 4401 Riverside Dr Unit E3
- 4404 Cloverdale St
- 4409 Mint Way
- 4521 Wood Duck Ave
- 4416 Mint Way
- 4242 N Riverside Dr
- 4223 Ptarmigan St
- 3049 Wood Duck Ave
- 8497 Mendenhall Loop Rd
- 4409 Julep St
- 4508 Dredge Lake Rd
- 4403 Sesame St
- 8350 River Place
- 9218 Emily Way
- 8251 Aspen Ave
- 8013 Magnolia Ct
- 8006 Poppy Ct
- 8012 Poppy Ct
- 8001 Magnolia Ct
- 8000 Poppy Ct
- 8112 Magnolia Ct
- 8118 Magnolia Ct
- 8007 Poppy Ct
- 8106 Magnolia Ct
- 8018 Poppy Ct
- 9708 Trappers Ln
- 5007 Pond Vista Dr
- 9709 Trappers Ln
- 8011 Poppy Ct
- 8001 Poppy Ct
- 9715 Trappers Ln
- 8024 Poppy Ct
- 5012 Pond Vista Dr
- 5031 Pond Vista Dr
- 9081 Ninnis Dr