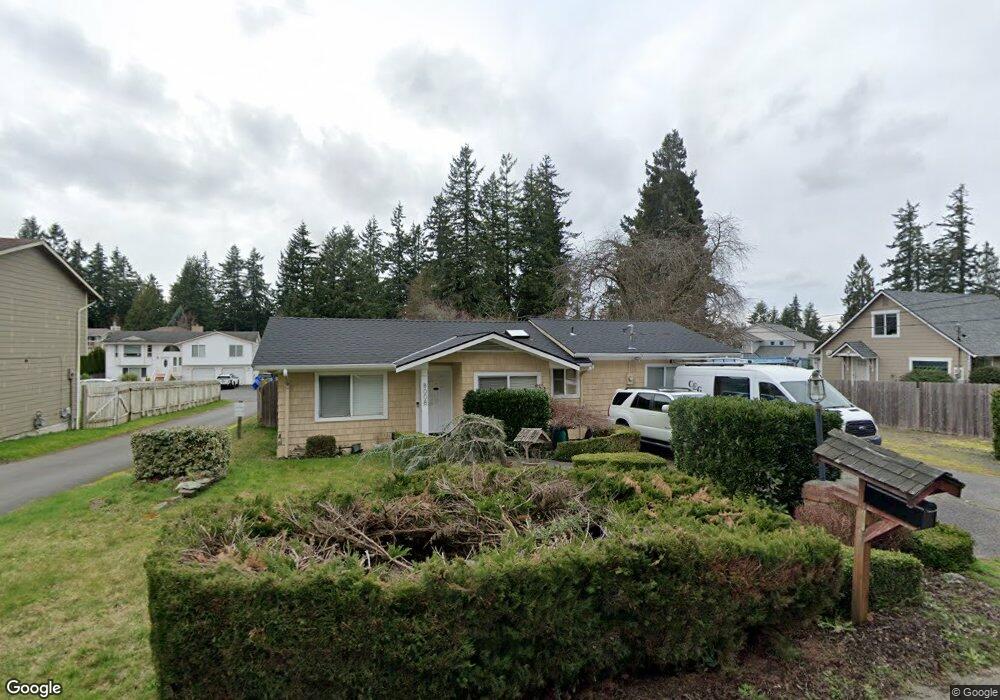
8008 Beverly Ln Everett, WA 98203
Evergreen NeighborhoodEstimated Value: $556,012 - $619,000
3
Beds
2
Baths
1,144
Sq Ft
$504/Sq Ft
Est. Value
About This Home
This home is located at 8008 Beverly Ln, Everett, WA 98203 and is currently estimated at $577,003, approximately $504 per square foot. 8008 Beverly Ln is a home located in Snohomish County with nearby schools including Lowell Elementary School, Evergreen Middle School, and Cascade High School.
Ownership History
Date
Name
Owned For
Owner Type
Purchase Details
Closed on
Jul 30, 2002
Sold by
Perez Devin E and Perez Reyna
Bought by
Murguia Adolfo
Current Estimated Value
Home Financials for this Owner
Home Financials are based on the most recent Mortgage that was taken out on this home.
Original Mortgage
$175,000
Outstanding Balance
$89,473
Interest Rate
9.54%
Estimated Equity
$487,530
Purchase Details
Closed on
Jun 4, 1999
Sold by
Panabaker Todd M and Panabaker Katherine D
Bought by
Perez Devin E and Perez Reyna
Home Financials for this Owner
Home Financials are based on the most recent Mortgage that was taken out on this home.
Original Mortgage
$148,927
Interest Rate
6.9%
Mortgage Type
FHA
Purchase Details
Closed on
Dec 7, 1993
Sold by
Vanoverbeke Dean E and Vanoverbeke Nancy
Bought by
Panabaker Todd M and Panabaker Katherine D
Home Financials for this Owner
Home Financials are based on the most recent Mortgage that was taken out on this home.
Original Mortgage
$90,700
Interest Rate
6.89%
Create a Home Valuation Report for This Property
The Home Valuation Report is an in-depth analysis detailing your home's value as well as a comparison with similar homes in the area
Home Values in the Area
Average Home Value in this Area
Purchase History
| Date | Buyer | Sale Price | Title Company |
|---|---|---|---|
| Murguia Adolfo | $175,000 | -- | |
| Perez Devin E | $149,950 | -- | |
| Panabaker Todd M | $95,500 | Stewart Title Company |
Source: Public Records
Mortgage History
| Date | Status | Borrower | Loan Amount |
|---|---|---|---|
| Open | Murguia Adolfo | $175,000 | |
| Previous Owner | Perez Devin E | $148,927 | |
| Previous Owner | Panabaker Todd M | $90,700 |
Source: Public Records
Tax History
| Year | Tax Paid | Tax Assessment Tax Assessment Total Assessment is a certain percentage of the fair market value that is determined by local assessors to be the total taxable value of land and additions on the property. | Land | Improvement |
|---|---|---|---|---|
| 2025 | $4,274 | $533,400 | $355,200 | $178,200 |
| 2024 | $4,274 | $496,500 | $318,300 | $178,200 |
| 2023 | $4,289 | $521,100 | $342,000 | $179,100 |
| 2022 | $3,068 | $334,200 | $242,100 | $92,100 |
| 2020 | $3,055 | $271,400 | $189,900 | $81,500 |
| 2019 | $2,828 | $252,900 | $172,800 | $80,100 |
| 2018 | $2,770 | $227,100 | $155,700 | $71,400 |
| 2017 | $2,403 | $196,300 | $133,200 | $63,100 |
| 2016 | $2,100 | $180,200 | $109,800 | $70,400 |
Source: Public Records
Map
Nearby Homes
- 7910 E Glen Dr
- 7525 Beverly Ln
- 126 W Casino Rd Unit 5
- 9 76th St SE
- 323 75th St SE Unit A14
- 323 75th St SE Unit B10
- 615 75th St SE Unit C52
- 8911 Holly Dr Unit 104
- 8823 Holly Dr Unit D203
- 8823 Holly Dr Unit C102
- 8823 Holly Dr Unit H206
- 8823 Holly Dr Unit H204
- 747 75th St SE Unit B203
- 501 75th Place SW
- 820 Cady Rd Unit H304
- 820 Cady Rd Unit B305
- 820 Cady Rd Unit F103
- 27 M Cascade Dr
- 6916 Beverly Ln
- 7515 Cascade Dr
- 7932 Beverly Ln
- 8014 Beverly Ln
- 202 79th Place SE
- 8020 Beverly Ln
- 8012 Beverly Ln
- 221 79th Place SE
- 217 79th Place SE
- 215 79th Place SE
- 8022 Beverly Ln
- 201 79th Place SE
- 8032 Beverly Ln
- 209 79th Place SE
- 201 79th Place SE
- 205 79th Place SE
- 8028 Beverly Ln
- 8102 Evergreen Way
- 8104 Beverly Ln
- 8104 Beverly Ln Unit Lt 1N
- 7830 Beverly Ln
- 118 79th Place SE
Your Personal Tour Guide
Ask me questions while you tour the home.