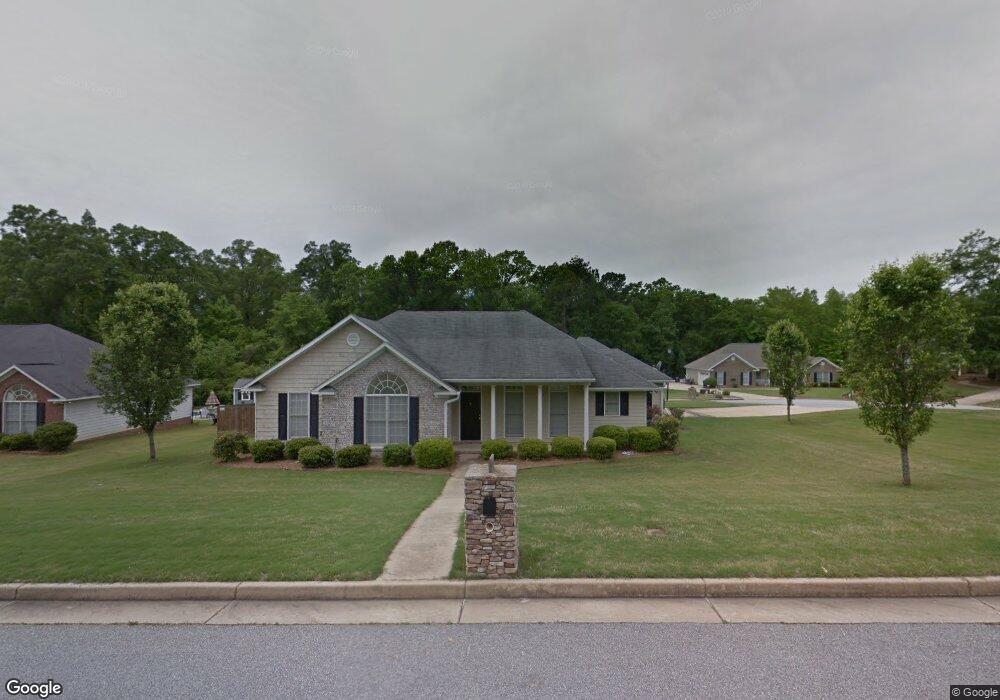
8009 Creek Flow Dr Midland, GA 31820
Midland NeighborhoodEstimated Value: $305,506 - $326,000
4
Beds
3
Baths
1,979
Sq Ft
$160/Sq Ft
Est. Value
About This Home
This home is located at 8009 Creek Flow Dr, Midland, GA 31820 and is currently estimated at $315,877, approximately $159 per square foot. 8009 Creek Flow Dr is a home located in Muscogee County with nearby schools including Mathews Elementary School, Aaron Cohn Middle School, and Shaw High School.
Ownership History
Date
Name
Owned For
Owner Type
Purchase Details
Closed on
May 31, 2016
Sold by
Starling Brad
Bought by
Shelhorse Bailey and Shelhorse Emma
Current Estimated Value
Home Financials for this Owner
Home Financials are based on the most recent Mortgage that was taken out on this home.
Original Mortgage
$124,000
Outstanding Balance
$98,819
Interest Rate
3.61%
Estimated Equity
$217,058
Purchase Details
Closed on
Mar 21, 2012
Sold by
Sec Of Veterans Affa
Bought by
Starling Bradley G
Home Financials for this Owner
Home Financials are based on the most recent Mortgage that was taken out on this home.
Original Mortgage
$138,400
Interest Rate
3.75%
Mortgage Type
FHA
Purchase Details
Closed on
Jun 7, 2011
Sold by
Freedom Mtg Corp
Bought by
Sec Of Veterans Affairs
Create a Home Valuation Report for This Property
The Home Valuation Report is an in-depth analysis detailing your home's value as well as a comparison with similar homes in the area
Home Values in the Area
Average Home Value in this Area
Purchase History
| Date | Buyer | Sale Price | Title Company |
|---|---|---|---|
| Shelhorse Bailey | $174,000 | -- | |
| Starling Bradley G | $138,400 | -- | |
| Sec Of Veterans Affairs | $158,193 | -- | |
| Freedom Mtg Corp | $158,193 | -- |
Source: Public Records
Mortgage History
| Date | Status | Borrower | Loan Amount |
|---|---|---|---|
| Open | Shelhorse Bailey | $124,000 | |
| Previous Owner | Starling Bradley G | $138,400 |
Source: Public Records
Tax History Compared to Growth
Tax History
| Year | Tax Paid | Tax Assessment Tax Assessment Total Assessment is a certain percentage of the fair market value that is determined by local assessors to be the total taxable value of land and additions on the property. | Land | Improvement |
|---|---|---|---|---|
| 2025 | $1,725 | $94,856 | $11,104 | $83,752 |
| 2024 | $1,724 | $94,856 | $11,104 | $83,752 |
| 2023 | $115 | $94,856 | $11,104 | $83,752 |
| 2022 | $1,811 | $75,924 | $11,104 | $64,820 |
| 2021 | $1,804 | $65,140 | $11,104 | $54,036 |
| 2020 | $1,805 | $65,140 | $11,104 | $54,036 |
| 2019 | $1,813 | $65,140 | $11,104 | $54,036 |
| 2018 | $1,813 | $65,140 | $11,104 | $54,036 |
| 2017 | $2,324 | $65,140 | $11,104 | $54,036 |
| 2016 | $1,805 | $64,420 | $11,600 | $52,820 |
| 2015 | $1,809 | $64,420 | $11,600 | $52,820 |
| 2014 | $1,812 | $70,556 | $11,600 | $58,956 |
| 2013 | -- | $70,556 | $11,600 | $58,956 |
Source: Public Records
Map
Nearby Homes
- 8013 Barton Dr
- 7107 Pine Seed Dr
- 9620 Hollow Pine Dr
- 9759 Pine Seed Ct
- 7133 Tall Pine Ct
- 7156 Tall Pine Ct
- 7390 Pine Tar Dr
- 7382 Pine Tar Dr
- 7337 Pine Tar Dr
- 7365 Pine Tar Dr
- 7346 Pine Chase Dr
- 7312 Pine Chase Dr
- 7359 Pine Tar Dr
- 7381 Pine Tar Dr
- 7333 Pine Chase Dr
- 7300 Pine Chase Dr
- 7343 Pine Chase Dr
- 7404 Prairie Valley Ct
- 4057 Pope Rd
- 8973 Orchard Valley Ln
- 7003 Crib Ct
- 8007 Creek Flow Dr
- 0 Creek Flow Dr
- 7000 Crib Ct
- 8011 Creek Flow Dr
- 7004 Crib Ct
- 8006 Creek Flow Dr
- 8008 Creek Flow Dr
- 8010 Creek Flow Dr
- 8004 Creek Flow Dr
- 8013 Creek Flow Dr
- 8012 Creek Flow Dr
- 4029 Hardwood Way
- 8002 Creek Flow Dr
- 8014 Creek Flow Dr
- 9935 Chattsworth Rd
- 4021 Hardwood Way
- 8017 Creek Flow Dr
- 4033 Hardwood Way
- 4005 Hardwood Way