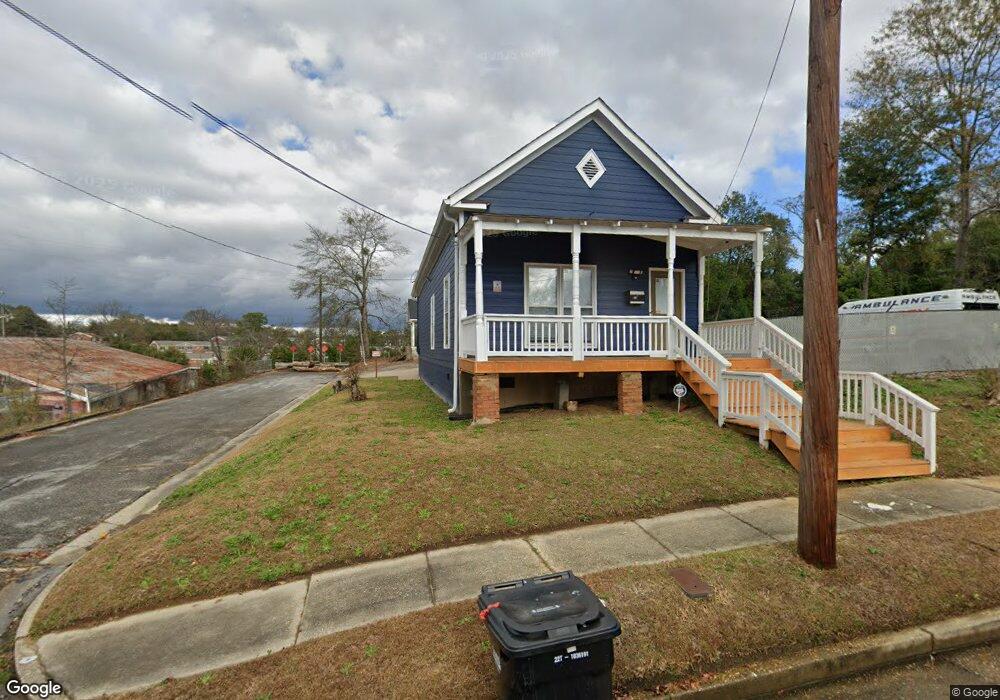
801 29th St Columbus, GA 31904
Waverly Terrace NeighborhoodEstimated Value: $76,702
3
Beds
1
Bath
720
Sq Ft
$107/Sq Ft
Est. Value
About This Home
This home is located at 801 29th St, Columbus, GA 31904 and is currently estimated at $76,702, approximately $106 per square foot. 801 29th St is a home located in Muscogee County with nearby schools including Hannan Elementary School, Double Churches Middle School, and Jordan Vocational High School.
Ownership History
Date
Name
Owned For
Owner Type
Purchase Details
Closed on
Feb 3, 2023
Sold by
Libran Jaime Roman
Bought by
Glory Brothers Transport Lllp
Current Estimated Value
Home Financials for this Owner
Home Financials are based on the most recent Mortgage that was taken out on this home.
Original Mortgage
$18,000
Outstanding Balance
$9,276
Interest Rate
5.14%
Mortgage Type
New Conventional
Estimated Equity
$67,426
Purchase Details
Closed on
Jun 30, 2021
Sold by
Fravel Charles Joseph
Bought by
Libran Jaime Roman
Home Financials for this Owner
Home Financials are based on the most recent Mortgage that was taken out on this home.
Original Mortgage
$44,925
Interest Rate
2.9%
Mortgage Type
Commercial
Purchase Details
Closed on
Feb 19, 2008
Sold by
Bullard Hugh
Bought by
Fravel Soraya
Purchase Details
Closed on
Feb 18, 2008
Sold by
Hack Fannie Lois
Bought by
Fravel Soraya
Purchase Details
Closed on
Aug 23, 2007
Sold by
Dolby Ellen L
Bought by
Fravel Soraya
Create a Home Valuation Report for This Property
The Home Valuation Report is an in-depth analysis detailing your home's value as well as a comparison with similar homes in the area
Home Values in the Area
Average Home Value in this Area
Purchase History
| Date | Buyer | Sale Price | Title Company |
|---|---|---|---|
| Glory Brothers Transport Lllp | $62,500 | -- | |
| Libran Jaime Roman | $59,900 | -- | |
| Fravel Soraya | -- | None Available | |
| Fravel Soraya | -- | None Available | |
| Fravel Soraya | -- | None Available | |
| Fravel Soraya | $31,996 | None Available |
Source: Public Records
Mortgage History
| Date | Status | Borrower | Loan Amount |
|---|---|---|---|
| Open | Glory Brothers Transport Lllp | $18,000 | |
| Previous Owner | Libran Jaime Roman | $44,925 |
Source: Public Records
Tax History Compared to Growth
Tax History
| Year | Tax Paid | Tax Assessment Tax Assessment Total Assessment is a certain percentage of the fair market value that is determined by local assessors to be the total taxable value of land and additions on the property. | Land | Improvement |
|---|---|---|---|---|
| 2025 | $1,067 | $27,247 | $11,292 | $15,955 |
| 2024 | $979 | $25,000 | $10,360 | $14,640 |
| 2023 | $1,162 | $29,504 | $11,292 | $18,212 |
| 2022 | $978 | $23,960 | $11,120 | $12,840 |
| 2021 | $1,068 | $25,920 | $11,292 | $14,628 |
| 2020 | $1,059 | $25,920 | $11,292 | $14,628 |
| 2019 | $1,062 | $25,920 | $11,292 | $14,628 |
| 2018 | $831 | $20,272 | $5,644 | $14,628 |
| 2017 | $833 | $20,272 | $5,644 | $14,628 |
| 2016 | $932 | $22,603 | $3,631 | $18,972 |
| 2015 | $373 | $22,603 | $3,631 | $18,972 |
| 2014 | $374 | $22,603 | $3,631 | $18,972 |
| 2013 | -- | $22,603 | $3,631 | $18,972 |
Source: Public Records
Map
Nearby Homes