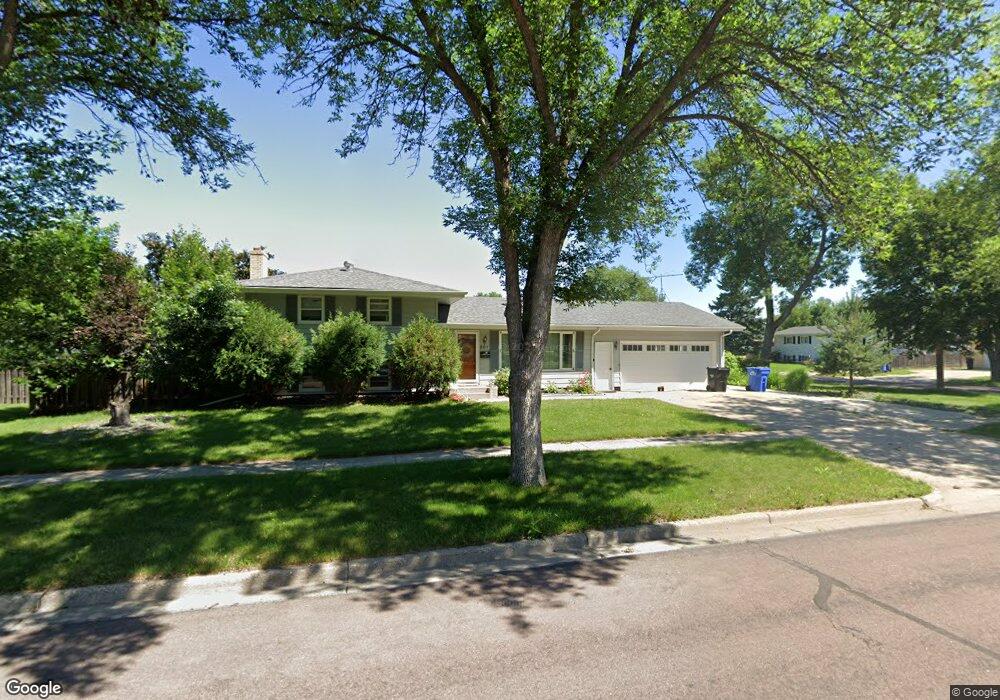
801 31st Ave N Fargo, ND 58102
Northport NeighborhoodEstimated Value: $251,000 - $299,533
--
Bed
--
Bath
1,132
Sq Ft
$242/Sq Ft
Est. Value
About This Home
This home is located at 801 31st Ave N, Fargo, ND 58102 and is currently estimated at $273,383, approximately $241 per square foot. 801 31st Ave N is a home located in Cass County with nearby schools including McKinley Elementary School, Ben Franklin Middle School, and North High School.
Ownership History
Date
Name
Owned For
Owner Type
Purchase Details
Closed on
Aug 15, 2013
Sold by
Berger Levi M and Berger Christina A
Bought by
Caldwell Tracy A
Current Estimated Value
Home Financials for this Owner
Home Financials are based on the most recent Mortgage that was taken out on this home.
Original Mortgage
$135,401
Interest Rate
3.85%
Mortgage Type
FHA
Purchase Details
Closed on
Jan 17, 2006
Sold by
Secretary Of Hud
Bought by
Berger Levi M and Berger Christina A
Home Financials for this Owner
Home Financials are based on the most recent Mortgage that was taken out on this home.
Original Mortgage
$99,200
Interest Rate
5.8%
Mortgage Type
FHA
Purchase Details
Closed on
Jul 21, 2005
Sold by
Sheriff Of Cass County
Bought by
Secretary Of Veterans Affairs
Create a Home Valuation Report for This Property
The Home Valuation Report is an in-depth analysis detailing your home's value as well as a comparison with similar homes in the area
Home Values in the Area
Average Home Value in this Area
Purchase History
| Date | Buyer | Sale Price | Title Company |
|---|---|---|---|
| Caldwell Tracy A | $137,900 | 19 Title Co | |
| Berger Levi M | -- | -- | |
| Secretary Of Veterans Affairs | -- | -- |
Source: Public Records
Mortgage History
| Date | Status | Borrower | Loan Amount |
|---|---|---|---|
| Open | Caldwell Tracy A | $159,200 | |
| Closed | Caldwell Tracy A | $135,401 | |
| Previous Owner | Berger Levi M | $99,200 |
Source: Public Records
Tax History Compared to Growth
Tax History
| Year | Tax Paid | Tax Assessment Tax Assessment Total Assessment is a certain percentage of the fair market value that is determined by local assessors to be the total taxable value of land and additions on the property. | Land | Improvement |
|---|---|---|---|---|
| 2024 | $3,417 | $119,900 | $20,350 | $99,550 |
| 2023 | $3,219 | $113,100 | $20,350 | $92,750 |
| 2022 | $3,156 | $107,700 | $20,350 | $87,350 |
| 2021 | $2,816 | $96,150 | $20,350 | $75,800 |
| 2020 | $2,873 | $99,600 | $23,800 | $75,800 |
| 2019 | $2,477 | $83,750 | $11,050 | $72,700 |
| 2018 | $2,342 | $83,750 | $11,050 | $72,700 |
| 2017 | $2,217 | $79,750 | $11,050 | $68,700 |
| 2016 | $1,969 | $77,450 | $11,050 | $66,400 |
| 2015 | $2,023 | $74,700 | $9,350 | $65,350 |
| 2014 | $1,980 | $71,150 | $9,350 | $61,800 |
| 2013 | $1,891 | $67,750 | $9,350 | $58,400 |
Source: Public Records
Map
Nearby Homes