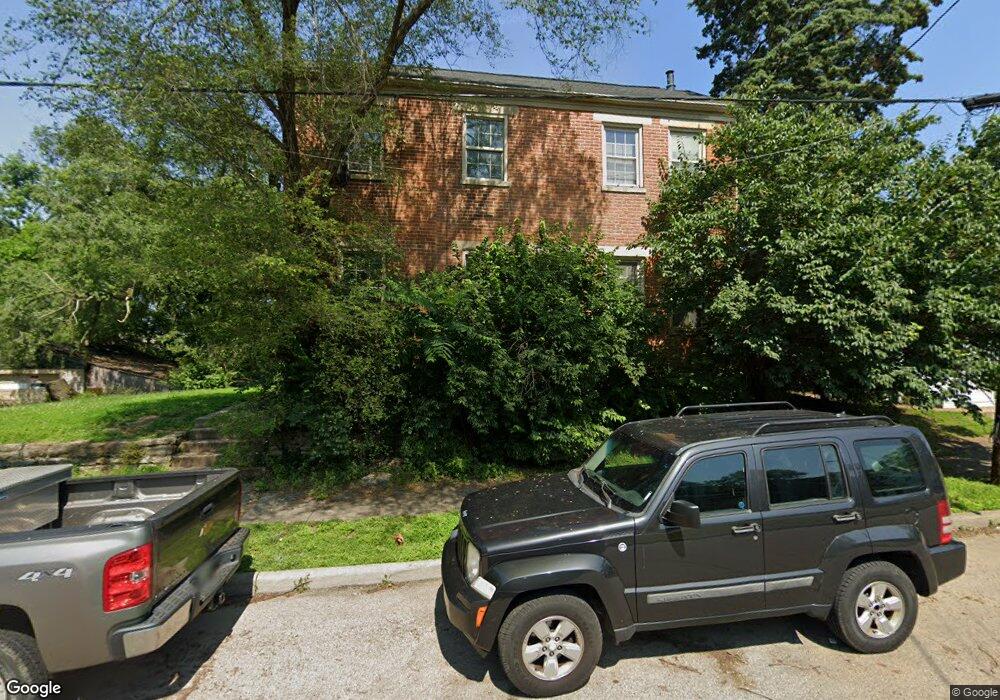
801 3rd St Cincinnati, OH 45215
Estimated Value: $95,511 - $133,000
Studio
--
Bath
--
Sq Ft
4,400
Sq Ft
About This Home
This home is located at 801 3rd St, Cincinnati, OH 45215 and is currently estimated at $114,256. 801 3rd St is a home located in Hamilton County with nearby schools including Reading Community High School, Saints Peter and Paul Academy, and Mount Notre Dame High School.
Ownership History
Date
Name
Owned For
Owner Type
Purchase Details
Closed on
Aug 5, 2022
Sold by
Luning and Olivia
Bought by
8013Rd Llc
Current Estimated Value
Purchase Details
Closed on
Jun 30, 2021
Sold by
Brown Kevin and Brown Sharon
Bought by
Luning Cullen
Home Financials for this Owner
Home Financials are based on the most recent Mortgage that was taken out on this home.
Original Mortgage
$60,000
Interest Rate
2.9%
Mortgage Type
New Conventional
Purchase Details
Closed on
Dec 31, 2012
Sold by
Mi Casa Properties Llc
Bought by
Brown Kevin
Home Financials for this Owner
Home Financials are based on the most recent Mortgage that was taken out on this home.
Original Mortgage
$81,496
Interest Rate
3.31%
Mortgage Type
FHA
Purchase Details
Closed on
Oct 17, 2001
Sold by
Richard J Gertz Enterprises Inc
Bought by
Hanavan Robert E and Hanavan Tuesday
Home Financials for this Owner
Home Financials are based on the most recent Mortgage that was taken out on this home.
Original Mortgage
$79,000
Interest Rate
6.92%
Create a Home Valuation Report for This Property
The Home Valuation Report is an in-depth analysis detailing your home's value as well as a comparison with similar homes in the area
Home Values in the Area
Average Home Value in this Area
Purchase History
| Date | Buyer | Sale Price | Title Company |
|---|---|---|---|
| 8013Rd Llc | -- | -- | |
| Luning Cullen | $80,000 | American Homeland Title | |
| Brown Kevin | $83,000 | Attorney | |
| Hanavan Robert E | $83,500 | -- |
Source: Public Records
Mortgage History
| Date | Status | Borrower | Loan Amount |
|---|---|---|---|
| Previous Owner | Luning Cullen | $60,000 | |
| Previous Owner | Brown Kevin | $81,496 | |
| Previous Owner | Hanavan Robert E | $79,000 |
Source: Public Records
Tax History
| Year | Tax Paid | Tax Assessment Tax Assessment Total Assessment is a certain percentage of the fair market value that is determined by local assessors to be the total taxable value of land and additions on the property. | Land | Improvement |
|---|---|---|---|---|
| 2025 | $404 | $7,442 | $3,959 | $3,483 |
| 2024 | $404 | $7,442 | $3,959 | $3,483 |
| 2023 | $403 | $7,442 | $3,959 | $3,483 |
| 2022 | $641 | $9,192 | $5,730 | $3,462 |
| 2021 | $549 | $9,192 | $5,730 | $3,462 |
| 2020 | $541 | $9,192 | $5,730 | $3,462 |
| 2019 | $527 | $8,135 | $5,072 | $3,063 |
| 2018 | $527 | $8,135 | $5,072 | $3,063 |
| 2017 | $504 | $8,135 | $5,072 | $3,063 |
| 2016 | $496 | $7,946 | $5,373 | $2,573 |
| 2015 | $493 | $7,946 | $5,373 | $2,573 |
| 2014 | $434 | $7,946 | $5,373 | $2,573 |
| 2013 | $440 | $8,106 | $5,481 | $2,625 |
Source: Public Records
Map
Nearby Homes
- 654 3rd St
- 0 Hill St Unit 1616370
- 129 Pike St
- 310 E Vine St
- 653 Harmes Ave
- 311 Southern Ave
- 321 Southern Ave
- 329 Walnut St
- 636 Maple Dr
- 1521 Hunt Rd
- 1401 Jefferson Ave
- 1421 Jefferson Ave
- 415 Arlington Ave
- 20 Clark Rd
- 2148 Julie Terrace
- 2113 Bolser Dr
- 234 Mcguire Ln
- 334 Williams St
- 2281 E Galbraith Rd
- 9350 Reading Rd
Your Personal Tour Guide
Ask me questions while you tour the home.