Estimated Value: $327,958 - $346,000
3
Beds
2
Baths
1,707
Sq Ft
$197/Sq Ft
Est. Value
About This Home
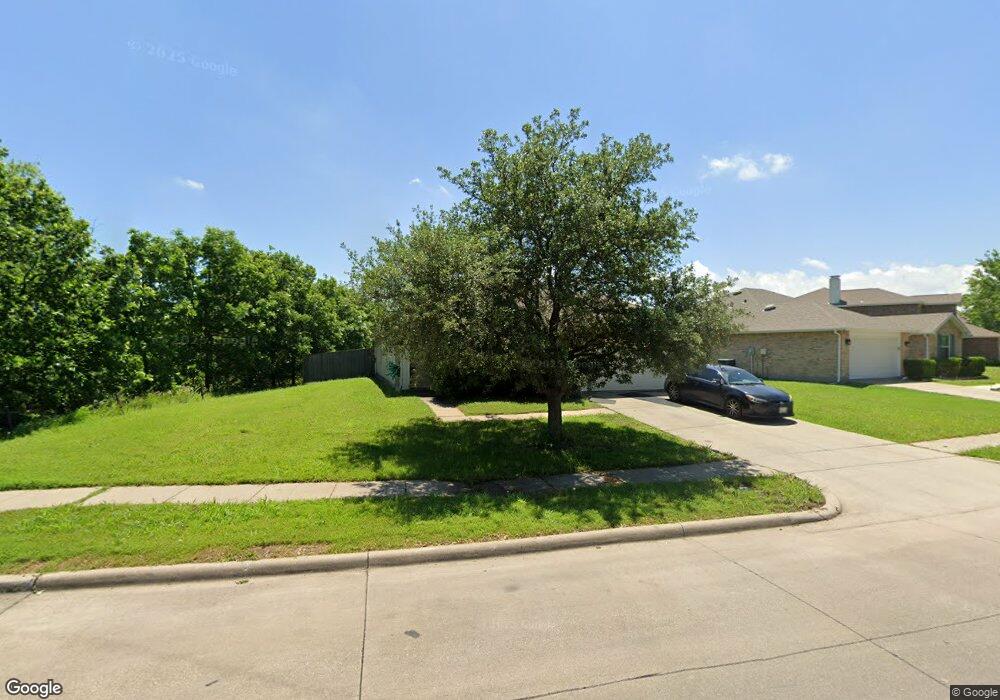
This home is located at 801 Ann Dr, Wylie, TX 75098 and is currently estimated at $336,990, approximately $197 per square foot. 801 Ann Dr is a home located in Collin County with nearby schools including T.F. Birmingham Elementary School, Frank Mcmillan Junior High School, and Davis Intermediate School.
Ownership History
Date
Name
Owned For
Owner Type
Purchase Details
Closed on
Aug 12, 2013
Sold by
Mattar Rafik S
Bought by
Rafik Mattar & Mirette Mattar Living Tru
Current Estimated Value
Purchase Details
Closed on
Nov 30, 2012
Sold by
Kulczewski Robert and Kulczewski Louise
Bought by
Mattar Rafik S
Home Financials for this Owner
Home Financials are based on the most recent Mortgage that was taken out on this home.
Original Mortgage
$77,000
Interest Rate
3.41%
Purchase Details
Closed on
Mar 22, 2005
Sold by
Centex Homes
Bought by
Kulczewski Robert and Kulczewski Louise
Home Financials for this Owner
Home Financials are based on the most recent Mortgage that was taken out on this home.
Original Mortgage
$84,500
Interest Rate
5.71%
Create a Home Valuation Report for This Property
The Home Valuation Report is an in-depth analysis detailing your home's value as well as a comparison with similar homes in the area
Home Values in the Area
Average Home Value in this Area
Purchase History
| Date | Buyer | Sale Price | Title Company |
|---|---|---|---|
| Rafik Mattar & Mirette Mattar Living Tru | -- | Adobe Title | |
| Mattar Rafik S | -- | Adobe Title | |
| Kulczewski Robert | -- | -- |
Source: Public Records
Mortgage History
| Date | Status | Borrower | Loan Amount |
|---|---|---|---|
| Previous Owner | Mattar Rafik S | $77,000 | |
| Previous Owner | Kulczewski Robert | $84,500 |
Source: Public Records
Tax History Compared to Growth
Tax History
| Year | Tax Paid | Tax Assessment Tax Assessment Total Assessment is a certain percentage of the fair market value that is determined by local assessors to be the total taxable value of land and additions on the property. | Land | Improvement |
|---|---|---|---|---|
| 2025 | $6,556 | $347,143 | $99,750 | $247,393 |
| 2024 | $6,556 | $335,128 | $99,750 | $232,199 |
| 2023 | $6,556 | $331,120 | $84,000 | $247,120 |
| 2022 | $6,673 | $304,170 | $84,000 | $220,170 |
| 2021 | $5,575 | $236,954 | $68,250 | $168,704 |
| 2020 | $5,175 | $208,417 | $57,750 | $150,667 |
| 2019 | $5,698 | $216,845 | $57,750 | $159,095 |
| 2018 | $5,664 | $210,317 | $57,750 | $152,567 |
| 2017 | $5,374 | $199,539 | $52,500 | $147,039 |
| 2016 | $4,763 | $171,417 | $42,000 | $129,417 |
| 2015 | $3,848 | $139,680 | $36,750 | $102,930 |
Source: Public Records
Map
Nearby Homes
- 626 Gunters Mountain Ln
- 902 Greene Way
- 908 Greene Way
- 705 Baldwin Rd
- 907 Carlton Rd
- 1003 Ann Dr
- 913 Chickesaw Ln
- 713 Kinston Ct
- 410 Oxford Dr
- 605 Graham Ct
- 1426 Mars Lander Ln
- Crest Plan at The Apollo
- Nova Plan at The Apollo
- Solis Plan at The Apollo
- 1422 Mars Lander Ln
- 1430 Mars Lander Ln
- 1432 Mars Lander Ln
- 1428 Mars Lander Ln
- 517 E Gaston Dr
- 1434 Mars Lander Ln