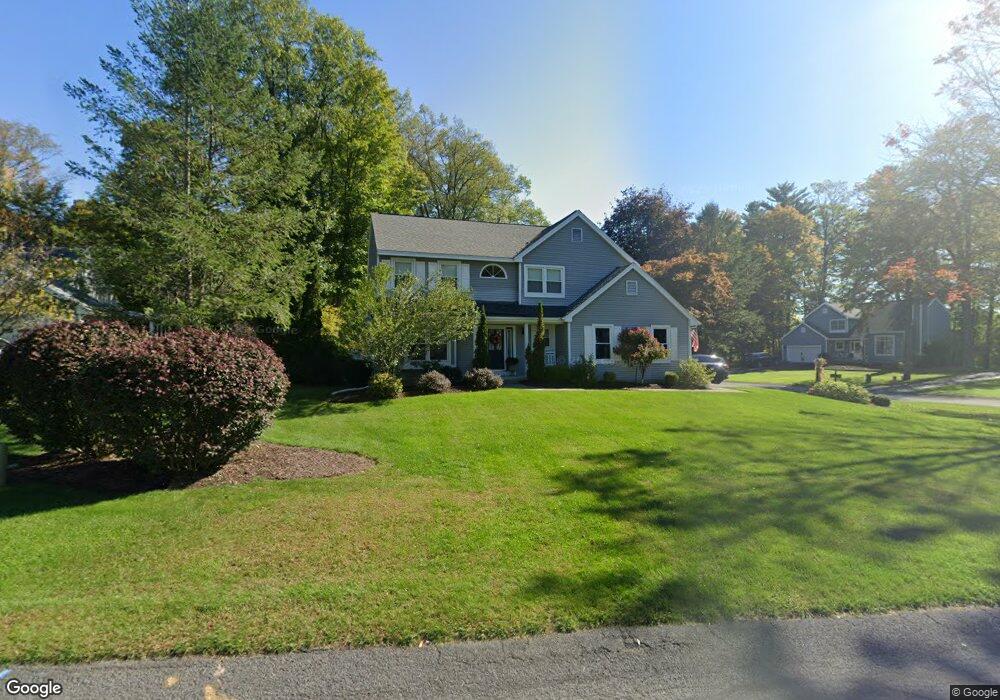
801 Beech Dr Schenectady, NY 12309
Estimated Value: $483,780 - $642,000
4
Beds
3
Baths
2,640
Sq Ft
$204/Sq Ft
Est. Value
About This Home
This home is located at 801 Beech Dr, Schenectady, NY 12309 and is currently estimated at $537,445, approximately $203 per square foot. 801 Beech Dr is a home located in Schenectady County with nearby schools including Veeder Elementary School, Lisha Kill Middle School, and Colonie Central High School.
Ownership History
Date
Name
Owned For
Owner Type
Purchase Details
Closed on
Dec 9, 2008
Sold by
Fusco Christina
Bought by
Lastarza Joshua
Current Estimated Value
Purchase Details
Closed on
Dec 7, 2007
Sold by
Weichert Relocation Resou Rces Inc
Bought by
Fusco Christina M
Home Financials for this Owner
Home Financials are based on the most recent Mortgage that was taken out on this home.
Original Mortgage
$200,000
Outstanding Balance
$126,592
Interest Rate
6.3%
Mortgage Type
Purchase Money Mortgage
Estimated Equity
$410,853
Purchase Details
Closed on
Dec 15, 2005
Sold by
Curran William J
Bought by
Meyer Cody J
Purchase Details
Closed on
Jul 1, 1996
Sold by
Royal Lepage Relocation Servic
Bought by
Curran William J and Curran Carol A
Create a Home Valuation Report for This Property
The Home Valuation Report is an in-depth analysis detailing your home's value as well as a comparison with similar homes in the area
Home Values in the Area
Average Home Value in this Area
Purchase History
| Date | Buyer | Sale Price | Title Company |
|---|---|---|---|
| Lastarza Joshua | -- | -- | |
| Lastarza Joshua M | -- | None Available | |
| Fusco Christina M | $335,000 | Mary Elizabeth Steven | |
| Weichert Relocation Resou Rces Inc | $332,500 | Peter Jones | |
| Meyer Cody J | $338,000 | Lhf Agency | |
| Curran William J | $165,000 | -- |
Source: Public Records
Mortgage History
| Date | Status | Borrower | Loan Amount |
|---|---|---|---|
| Open | Weichert Relocation Resou Rces Inc | $200,000 | |
| Closed | Weichert Relocation Resou Rces Inc | $200,000 |
Source: Public Records
Tax History
| Year | Tax Paid | Tax Assessment Tax Assessment Total Assessment is a certain percentage of the fair market value that is determined by local assessors to be the total taxable value of land and additions on the property. | Land | Improvement |
|---|---|---|---|---|
| 2024 | -- | $310,500 | $45,360 | $265,140 |
| 2023 | -- | $310,500 | $45,360 | $265,140 |
| 2022 | -- | $310,500 | $45,360 | $265,140 |
| 2021 | $0 | $310,500 | $45,360 | $265,140 |
| 2020 | $0 | $310,500 | $45,360 | $265,140 |
| 2019 | -- | $310,500 | $45,360 | $265,140 |
| 2018 | $8,827 | $310,500 | $45,360 | $265,140 |
| 2017 | $8,827 | $310,500 | $45,360 | $265,140 |
| 2016 | $8,827 | $310,500 | $45,360 | $265,140 |
| 2015 | -- | $310,500 | $45,360 | $265,140 |
| 2014 | -- | $310,500 | $45,360 | $265,140 |
Source: Public Records
Map
Nearby Homes
- 647 Pearse Rd
- 26 Sussex Way
- 31 Amelia Dr
- 766 Westmoreland Dr
- 4110 Consaul Rd
- 41 Empire Dr
- 2510 Troy-Schenectady Rd
- 707 Lois Ln
- 309 Lois Ln
- 214 Lois Ln
- 245 N Alandale Ave
- 151 Fieldstone Dr
- 2460 Troy-Schenectady Rd
- 2808 Troy Schenectady Rd
- 18 Dublin Dr
- 145 Killarney Dr
- 28 Fullerton Ave
- 62 Mary Hadge Dr
- 65 Dublin Dr
- 2167 Central Ave
Your Personal Tour Guide
Ask me questions while you tour the home.