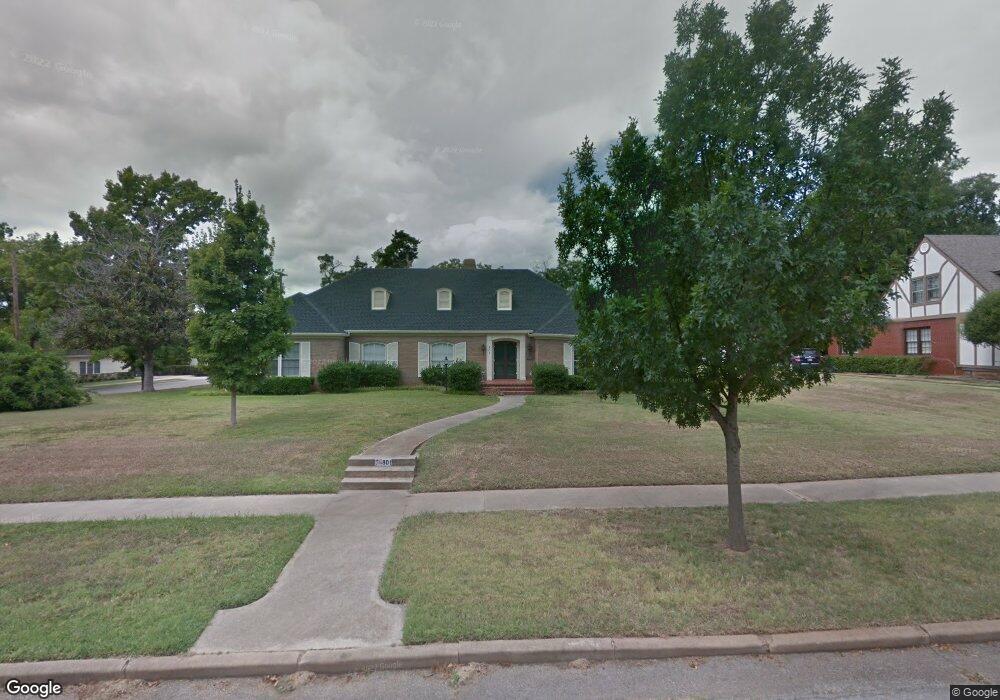
801 D St NW Ardmore, OK 73401
Estimated Value: $184,000 - $466,000
4
Beds
5
Baths
3,764
Sq Ft
$87/Sq Ft
Est. Value
About This Home
This home is located at 801 D St NW, Ardmore, OK 73401 and is currently estimated at $327,475, approximately $87 per square foot. 801 D St NW is a home located in Carter County with nearby schools including Charles Evans Elementary School, Ardmore Middle School, and Ardmore High School.
Ownership History
Date
Name
Owned For
Owner Type
Purchase Details
Closed on
Nov 21, 2016
Sold by
Johnson Aaron and Johnson Dortha
Bought by
Hodges Freddie and Hodges Loretta
Current Estimated Value
Home Financials for this Owner
Home Financials are based on the most recent Mortgage that was taken out on this home.
Original Mortgage
$139,590
Outstanding Balance
$88,492
Interest Rate
3.47%
Mortgage Type
Commercial
Estimated Equity
$238,983
Purchase Details
Closed on
Mar 26, 2004
Sold by
Galt Freeman P
Bought by
Hart Lori D Johnson Jenni
Create a Home Valuation Report for This Property
The Home Valuation Report is an in-depth analysis detailing your home's value as well as a comparison with similar homes in the area
Purchase History
| Date | Buyer | Sale Price | Title Company |
|---|---|---|---|
| Hodges Freddie | $155,500 | Stewart Abstract & Title | |
| Hart Lori D Johnson Jenni | $54,000 | -- |
Source: Public Records
Mortgage History
| Date | Status | Borrower | Loan Amount |
|---|---|---|---|
| Open | Hodges Freddie | $139,590 |
Source: Public Records
Tax History
| Year | Tax Paid | Tax Assessment Tax Assessment Total Assessment is a certain percentage of the fair market value that is determined by local assessors to be the total taxable value of land and additions on the property. | Land | Improvement |
|---|---|---|---|---|
| 2025 | -- | $26,126 | $1,340 | $24,786 |
| 2024 | -- | $25,364 | $1,301 | $24,063 |
| 2023 | $0 | $24,625 | $1,297 | $23,328 |
| 2022 | $0 | $23,909 | $1,293 | $22,616 |
| 2021 | $2,124 | $23,212 | $1,285 | $21,927 |
| 2020 | $2,124 | $22,536 | $1,275 | $21,261 |
| 2019 | $2,124 | $21,879 | $1,275 | $20,604 |
| 2018 | $2,057 | $20,838 | $1,275 | $19,563 |
| 2017 | $1,669 | $19,846 | $1,275 | $18,571 |
| 2016 | $1,669 | $18,901 | $1,275 | $17,626 |
| 2015 | $1,333 | $18,351 | $1,275 | $17,076 |
| 2014 | $1,505 | $17,816 | $1,275 | $16,541 |
Source: Public Records
Map
Nearby Homes
Your Personal Tour Guide
Ask me questions while you tour the home.