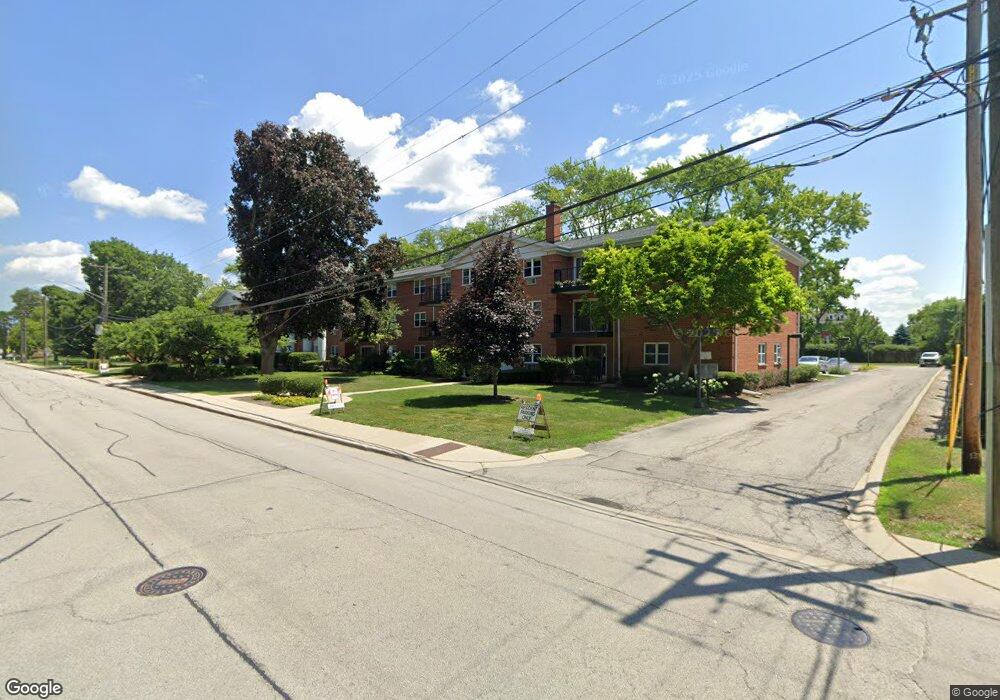
801 E Miner St Unit 8013A Arlington Heights, IL 60004
Estimated Value: $185,247 - $222,000
2
Beds
--
Bath
1,100
Sq Ft
$182/Sq Ft
Est. Value
About This Home
This home is located at 801 E Miner St Unit 8013A, Arlington Heights, IL 60004 and is currently estimated at $199,812, approximately $181 per square foot. 801 E Miner St Unit 8013A is a home located in Cook County with nearby schools including Windsor Elementary School, South Middle School, and Prospect High School.
Ownership History
Date
Name
Owned For
Owner Type
Purchase Details
Closed on
Nov 13, 2020
Sold by
Cameron Daniel G and Cameron Karen L
Bought by
Vasileva Sevdelina
Current Estimated Value
Home Financials for this Owner
Home Financials are based on the most recent Mortgage that was taken out on this home.
Original Mortgage
$94,500
Interest Rate
2.37%
Mortgage Type
New Conventional
Purchase Details
Closed on
Aug 29, 2012
Sold by
Federal Home Loan Mortgage Corporation
Bought by
Cameron Karen L and Cameron Daniel G
Purchase Details
Closed on
Feb 27, 2012
Sold by
Nielsen William
Bought by
Federal Home Loan Mortgage Corporation
Purchase Details
Closed on
Jul 25, 2001
Sold by
Drury Thomas J and Drury Cheryl Ann
Bought by
Nielsen William T
Home Financials for this Owner
Home Financials are based on the most recent Mortgage that was taken out on this home.
Original Mortgage
$114,000
Interest Rate
7.14%
Create a Home Valuation Report for This Property
The Home Valuation Report is an in-depth analysis detailing your home's value as well as a comparison with similar homes in the area
Home Values in the Area
Average Home Value in this Area
Purchase History
| Date | Buyer | Sale Price | Title Company |
|---|---|---|---|
| Vasileva Sevdelina | $126,000 | Attorneys Ttl Guaranty Fund | |
| Cameron Karen L | $105,000 | First American Title | |
| Federal Home Loan Mortgage Corporation | -- | None Available | |
| Nielsen William T | $114,000 | 1St American Title |
Source: Public Records
Mortgage History
| Date | Status | Borrower | Loan Amount |
|---|---|---|---|
| Previous Owner | Vasileva Sevdelina | $94,500 | |
| Previous Owner | Nielsen William T | $114,000 |
Source: Public Records
Tax History Compared to Growth
Tax History
| Year | Tax Paid | Tax Assessment Tax Assessment Total Assessment is a certain percentage of the fair market value that is determined by local assessors to be the total taxable value of land and additions on the property. | Land | Improvement |
|---|---|---|---|---|
| 2024 | $3,608 | $13,180 | $2,296 | $10,884 |
| 2023 | $3,475 | $13,180 | $2,296 | $10,884 |
| 2022 | $3,475 | $13,180 | $2,296 | $10,884 |
| 2021 | $3,208 | $10,658 | $286 | $10,372 |
| 2020 | $3,125 | $10,658 | $286 | $10,372 |
| 2019 | $3,110 | $11,845 | $286 | $11,559 |
| 2018 | $2,243 | $7,685 | $229 | $7,456 |
| 2017 | $2,216 | $7,685 | $229 | $7,456 |
| 2016 | $2,067 | $7,685 | $229 | $7,456 |
| 2015 | $1,986 | $6,727 | $1,090 | $5,637 |
| 2014 | $1,928 | $6,727 | $1,090 | $5,637 |
| 2013 | $1,880 | $6,727 | $1,090 | $5,637 |
Source: Public Records
Map
Nearby Homes
- 805 E Hamlin Ln
- 415 N Haddow Ave
- 32 N Belmont Ave
- 104 N Pine Ave Unit 505
- 315 S Beverly Ln
- 300 E Euclid Ave
- 77 S Evergreen Ave Unit 606
- 816 E Mayfair Rd
- 315 N Drury Ln
- 703 N Arlington Heights Rd
- 201 N Vail Ave Unit 305
- 423 S Beverly Ln
- 417 S Dryden Place
- 1615 E Miner St
- 430 S Dryden Place
- 105 S Vail Ave
- 121 S Vail Ave Unit 403
- 121 S Vail Ave Unit 401
- 1209 E Davis St
- 1 S Highland Ave Unit 800
- 801 E Miner St Unit 2C
- 801 E Miner St Unit 8013C
- 801 E Miner St Unit 8012D
- 801 E Miner St Unit 8012C
- 801 E Miner St Unit 8011C
- 801 E Miner St Unit 8013D
- 801 E Miner St Unit 8012B
- 801 E Miner St Unit 8011D
- 801 E Miner St Unit 8013B
- 801 E Miner St Unit 8011B
- 801 E Miner St Unit 8011A
- 801 E Miner St Unit 8012A
- 801 E Miner St Unit 3A
- 801 E Miner St Unit 3B
- 801 E Miner St Unit 3D
- 801 E Miner St Unit 3C
- 801 E Miner St Unit 2B
- 801 E Miner St Unit 1B
- 801 E Miner St Unit 1D
- 809 E Miner St Unit 2A