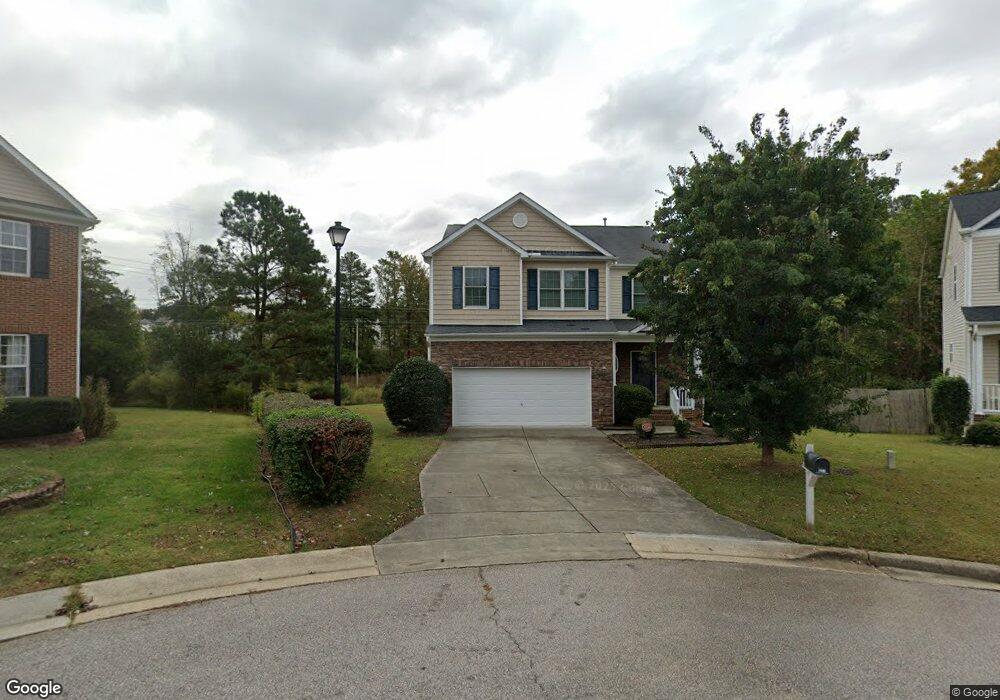
801 Edgeware Way Wake Forest, NC 27587
Estimated Value: $390,671 - $426,000
3
Beds
3
Baths
2,296
Sq Ft
$177/Sq Ft
Est. Value
About This Home
This home is located at 801 Edgeware Way, Wake Forest, NC 27587 and is currently estimated at $406,890, approximately $177 per square foot. 801 Edgeware Way is a home located in Franklin County with nearby schools including Youngsville Elementary, Cedar Creek Middle, and Franklinton High School.
Ownership History
Date
Name
Owned For
Owner Type
Purchase Details
Closed on
May 30, 2019
Sold by
Stallings Tyler and Stallings Bonnie
Bought by
Boyd Clifford and Briggs Venesa
Current Estimated Value
Home Financials for this Owner
Home Financials are based on the most recent Mortgage that was taken out on this home.
Original Mortgage
$247,435
Outstanding Balance
$219,474
Interest Rate
4.75%
Mortgage Type
FHA
Estimated Equity
$187,416
Purchase Details
Closed on
May 17, 2013
Sold by
D R Horton Inc
Bought by
Stallings Tyler and Stallings Bonnie
Home Financials for this Owner
Home Financials are based on the most recent Mortgage that was taken out on this home.
Original Mortgage
$198,979
Interest Rate
3.56%
Mortgage Type
New Conventional
Purchase Details
Closed on
Feb 28, 2012
Sold by
Richland Hills Associates Llc
Bought by
D R Horton Inc
Purchase Details
Closed on
Jun 27, 2001
Bought by
Richland Hills Associates Llc
Create a Home Valuation Report for This Property
The Home Valuation Report is an in-depth analysis detailing your home's value as well as a comparison with similar homes in the area
Home Values in the Area
Average Home Value in this Area
Purchase History
| Date | Buyer | Sale Price | Title Company |
|---|---|---|---|
| Boyd Clifford | $252,000 | None Available | |
| Stallings Tyler | $195,000 | None Available | |
| D R Horton Inc | $555,000 | None Available | |
| Richland Hills Associates Llc | $894,000 | -- |
Source: Public Records
Mortgage History
| Date | Status | Borrower | Loan Amount |
|---|---|---|---|
| Open | Boyd Clifford | $247,435 | |
| Previous Owner | Stallings Tyler | $198,979 |
Source: Public Records
Tax History
| Year | Tax Paid | Tax Assessment Tax Assessment Total Assessment is a certain percentage of the fair market value that is determined by local assessors to be the total taxable value of land and additions on the property. | Land | Improvement |
|---|---|---|---|---|
| 2025 | $1,811 | $387,510 | $115,000 | $272,510 |
| 2024 | $3,815 | $387,510 | $115,000 | $272,510 |
| 2023 | $2,917 | $217,620 | $42,000 | $175,620 |
| 2022 | $2,886 | $217,620 | $42,000 | $175,620 |
| 2021 | $2,907 | $217,620 | $42,000 | $175,620 |
| 2020 | $2,915 | $217,620 | $42,000 | $175,620 |
| 2019 | $2,959 | $217,620 | $42,000 | $175,620 |
| 2018 | $2,954 | $217,620 | $42,000 | $175,620 |
| 2017 | $2,674 | $184,240 | $42,000 | $142,240 |
| 2016 | $2,742 | $184,240 | $42,000 | $142,240 |
| 2015 | $2,742 | $184,240 | $42,000 | $142,240 |
| 2014 | $2,621 | $184,240 | $42,000 | $142,240 |
Source: Public Records
Map
Nearby Homes
- 1325 Marbank St
- 825 Fulworth Ave
- 509 Rain Drizzle Ct
- 833 Whistable Ave
- 860 Whistable Ave
- 1434 Chatuga Way
- 1305 Hosmer Ct
- 1116 Crendall Way
- 1544 Crimson Leaf Ln
- 1209 Partington St
- 913 Whistable Ave
- 1444 Montonia St
- 1442 Montonia St
- 508 Ferry Ct
- 0 Ralph Dr
- 1133 Bellreng Dr
- 1205 Barnford Mill Rd
- 104 Jordan Ln
- 1011 Barnford Mill Rd
- 1745 Ripley Woods St
- 801 Edgeware Way Unit Lt175
- 801 Edgeware Way
- 805 Edgeware Way Unit LT174
- 805 Edgeware Way
- 800 Edgeware Way
- 809 Edgeware Way
- 809 Edgeware Way Unit L0173
- 804 Edgeware Way
- 1300 Lowenstein St
- 1300 Lowenstein St Unit LT178
- 813 Edgeware Way Unit LT172
- 817 Edgeware Way Unit LT171
- 817 Edgeware Way
- 1304 Lowenstein St Unit LT179
- 1301 Lowenstein St
- 1308 Lowenstein St Unit Lot 00.0180
- 1308 Lowenstein St
- 821 Edgeware Way
- 1305 Lowenstein St
- 1441 Haltwhistle St Unit 13
Your Personal Tour Guide
Ask me questions while you tour the home.