Estimated Value: $66,000 - $146,000
2
Beds
1
Bath
1,184
Sq Ft
$94/Sq Ft
Est. Value
About This Home
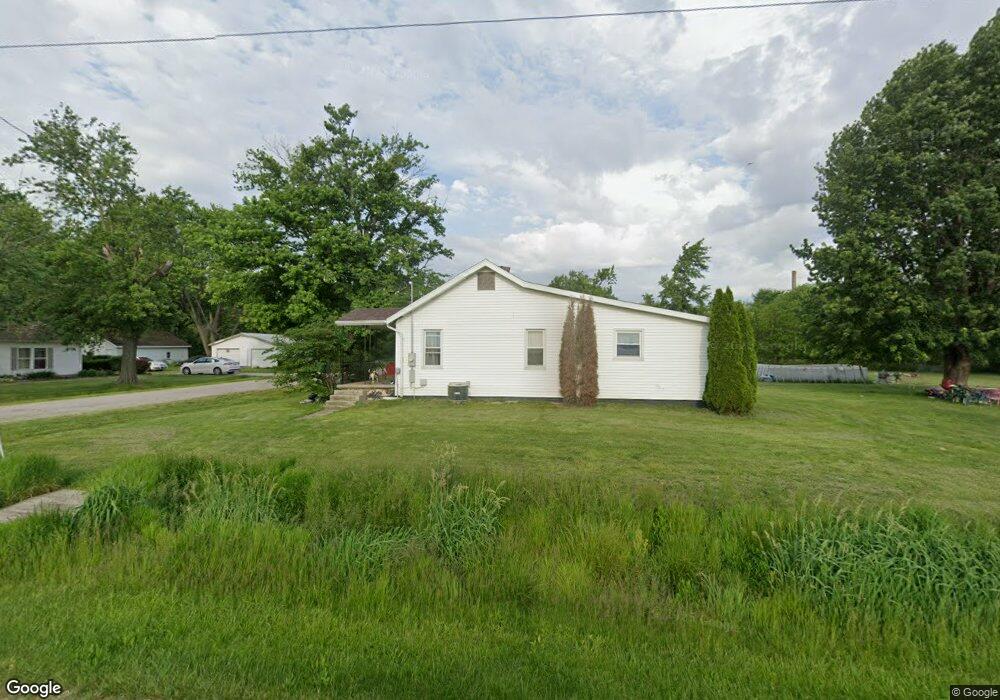
This home is located at 801 Elm St, Pana, IL 62557 and is currently estimated at $110,933, approximately $93 per square foot. 801 Elm St is a home located in Christian County with nearby schools including Washington Elementary School, Lincoln Elementary School, and Pana Jr High School.
Ownership History
Date
Name
Owned For
Owner Type
Purchase Details
Closed on
Aug 10, 2018
Sold by
Jp Morgan Chase Bank Na
Bought by
Smith Kimberly D
Current Estimated Value
Purchase Details
Closed on
Mar 27, 2018
Sold by
Bolyard Jeffery J Est
Bought by
Damery Vicky L
Purchase Details
Closed on
Nov 19, 2007
Sold by
Moss Robin and Morgan Stuart S
Bought by
Bolyard Jeffery J
Home Financials for this Owner
Home Financials are based on the most recent Mortgage that was taken out on this home.
Original Mortgage
$66,000
Interest Rate
6.47%
Mortgage Type
New Conventional
Create a Home Valuation Report for This Property
The Home Valuation Report is an in-depth analysis detailing your home's value as well as a comparison with similar homes in the area
Home Values in the Area
Average Home Value in this Area
Purchase History
| Date | Buyer | Sale Price | Title Company |
|---|---|---|---|
| Smith Kimberly D | -- | -- | |
| Damery Vicky L | -- | -- | |
| Bolyard Jeffery J | $63,000 | Advanced Title Group Inc |
Source: Public Records
Mortgage History
| Date | Status | Borrower | Loan Amount |
|---|---|---|---|
| Previous Owner | Bolyard Jeffery J | $66,000 |
Source: Public Records
Tax History Compared to Growth
Tax History
| Year | Tax Paid | Tax Assessment Tax Assessment Total Assessment is a certain percentage of the fair market value that is determined by local assessors to be the total taxable value of land and additions on the property. | Land | Improvement |
|---|---|---|---|---|
| 2024 | $1,389 | $26,449 | $9,406 | $17,043 |
| 2023 | $1,305 | $24,990 | $8,887 | $16,103 |
| 2022 | $1,072 | $21,152 | $6,433 | $14,719 |
| 2021 | $1,049 | $20,698 | $6,268 | $14,430 |
| 2020 | $1,431 | $19,800 | $5,982 | $13,818 |
| 2019 | $1,453 | $20,209 | $6,066 | $14,143 |
| 2018 | $1,381 | $19,025 | $5,189 | $13,836 |
| 2017 | $1,404 | $19,366 | $5,248 | $14,118 |
| 2016 | $1,394 | $19,282 | $5,203 | $14,079 |
| 2015 | $1,390 | $19,035 | $5,119 | $13,916 |
| 2014 | $936 | $17,733 | $4,790 | $12,943 |
| 2013 | $941 | $18,793 | $4,735 | $14,058 |
| 2011 | $941 | $19,165 | $4,775 | $14,390 |
Source: Public Records
Map
Nearby Homes