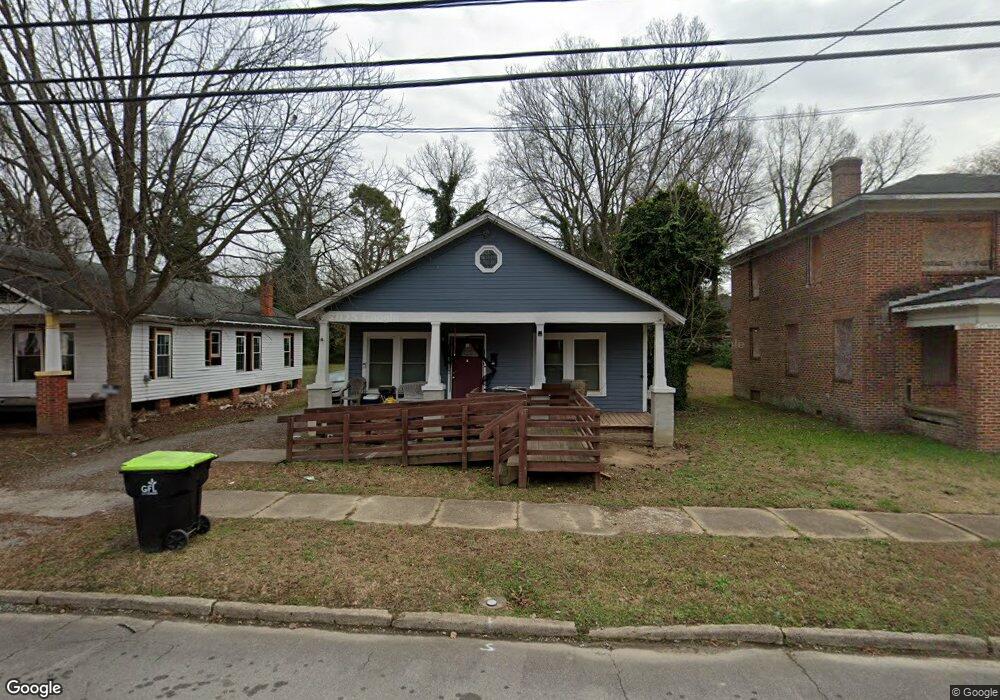
801 Elm St Weldon, NC 27890
Estimated Value: $47,000 - $60,771
3
Beds
1
Bath
1,120
Sq Ft
$50/Sq Ft
Est. Value
About This Home
This home is located at 801 Elm St, Weldon, NC 27890 and is currently estimated at $55,443, approximately $49 per square foot. 801 Elm St is a home located in Halifax County with nearby schools including Weldon Elementary Global Academy, Weldon Middle School, and Roanoke Valley Early College.
Ownership History
Date
Name
Owned For
Owner Type
Purchase Details
Closed on
May 6, 2020
Sold by
Ggc Rentals Llc
Bought by
Bennett Derrick M
Current Estimated Value
Home Financials for this Owner
Home Financials are based on the most recent Mortgage that was taken out on this home.
Original Mortgage
$55,000
Interest Rate
3.2%
Purchase Details
Closed on
Oct 10, 2010
Sold by
Conwell Garland G
Bought by
Price Elizabeth C
Purchase Details
Closed on
Aug 9, 2005
Sold by
Clark Michael and Clark Evellyn K
Bought by
Conwell Garland G
Create a Home Valuation Report for This Property
The Home Valuation Report is an in-depth analysis detailing your home's value as well as a comparison with similar homes in the area
Home Values in the Area
Average Home Value in this Area
Purchase History
| Date | Buyer | Sale Price | Title Company |
|---|---|---|---|
| Bennett Derrick M | $55,000 | None Available | |
| Price Elizabeth C | -- | -- | |
| Conwell Garland G | $5,500 | None Available |
Source: Public Records
Mortgage History
| Date | Status | Borrower | Loan Amount |
|---|---|---|---|
| Previous Owner | Bennett Derrick M | $55,000 |
Source: Public Records
Tax History Compared to Growth
Tax History
| Year | Tax Paid | Tax Assessment Tax Assessment Total Assessment is a certain percentage of the fair market value that is determined by local assessors to be the total taxable value of land and additions on the property. | Land | Improvement |
|---|---|---|---|---|
| 2025 | $9 | $40,400 | $3,600 | $36,800 |
| 2024 | $9 | $40,400 | $3,600 | $36,800 |
| 2023 | $331 | $3,600 | $3,600 | $0 |
| 2022 | $304 | $3,600 | $3,600 | $0 |
| 2021 | $296 | $3,600 | $3,600 | $0 |
| 2020 | $298 | $3,600 | $3,600 | $0 |
| 2019 | $368 | $7,500 | $3,600 | $3,900 |
| 2018 | $334 | $7,500 | $3,600 | $3,900 |
| 2017 | $334 | $7,500 | $3,600 | $3,900 |
| 2016 | $360 | $7,500 | $3,600 | $3,900 |
| 2015 | $339 | $7,500 | $3,600 | $3,900 |
| 2014 | $689 | $32,130 | $5,150 | $26,980 |
Source: Public Records
Map
Nearby Homes
- 931 Washington Ave
- 1029 Washington Ave
- 20 Acres Hwy 301
- 407 Brownell St
- 0 County Rd
- 1406 Elm St
- 0 Premier Blvd Unit 139882
- 177 Hilltop Dr
- 1515 4th Ave
- 1511 4th Ave
- Lot 88R Old Farm Rd
- 0 Old Farm Rd
- 1507 4th Ave
- 1501 4th Ave
- 305 Rollingwood Rd
- 228 Old Farm Rd
- 104 Dunshill Rd
- 7 Highway 125
- 10-A Highway 125
- 8 Gregory Dr