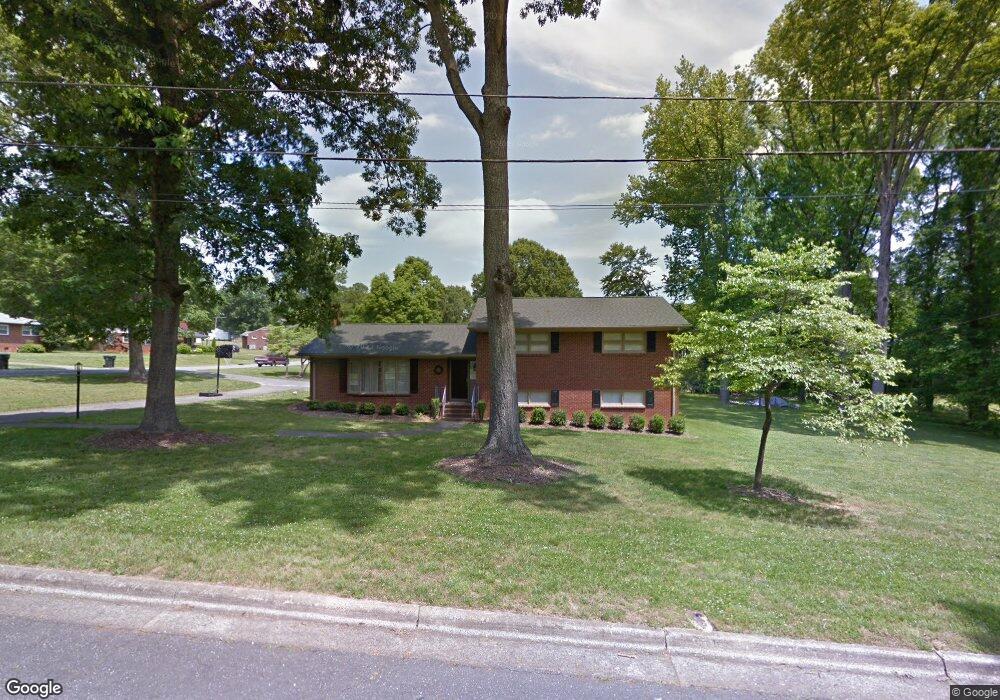
801 Henry St Kings Mountain, NC 28086
Estimated Value: $296,000 - $351,000
5
Beds
4
Baths
1,731
Sq Ft
$190/Sq Ft
Est. Value
About This Home
This home is located at 801 Henry St, Kings Mountain, NC 28086 and is currently estimated at $329,613, approximately $190 per square foot. 801 Henry St is a home located in Cleveland County with nearby schools including East Elementary School, Kings Mountain Middle, and Kings Mountain Intermediate School.
Ownership History
Date
Name
Owned For
Owner Type
Purchase Details
Closed on
Mar 11, 2009
Sold by
Lynch Jason Todd and Lynch Michelle T
Bought by
Worley Roger N and Worley Ronda
Current Estimated Value
Home Financials for this Owner
Home Financials are based on the most recent Mortgage that was taken out on this home.
Original Mortgage
$146,300
Outstanding Balance
$93,076
Interest Rate
5.14%
Mortgage Type
New Conventional
Estimated Equity
$236,537
Purchase Details
Closed on
Mar 22, 2006
Sold by
Grant John D and Grant Michele R
Bought by
Lynch Jason Todd and Lynch Michelle
Purchase Details
Closed on
Jun 1, 2005
Sold by
Green Robert David
Bought by
Grant John D and Grant Michele R
Home Financials for this Owner
Home Financials are based on the most recent Mortgage that was taken out on this home.
Original Mortgage
$115,000
Interest Rate
5.66%
Mortgage Type
Future Advance Clause Open End Mortgage
Create a Home Valuation Report for This Property
The Home Valuation Report is an in-depth analysis detailing your home's value as well as a comparison with similar homes in the area
Home Values in the Area
Average Home Value in this Area
Purchase History
| Date | Buyer | Sale Price | Title Company |
|---|---|---|---|
| Worley Roger N | $154,000 | None Available | |
| Lynch Jason Todd | $150,000 | None Available | |
| Grant John D | $115,000 | None Available |
Source: Public Records
Mortgage History
| Date | Status | Borrower | Loan Amount |
|---|---|---|---|
| Open | Worley Roger N | $146,300 | |
| Previous Owner | Grant John D | $115,000 |
Source: Public Records
Tax History Compared to Growth
Tax History
| Year | Tax Paid | Tax Assessment Tax Assessment Total Assessment is a certain percentage of the fair market value that is determined by local assessors to be the total taxable value of land and additions on the property. | Land | Improvement |
|---|---|---|---|---|
| 2025 | $2,657 | $259,171 | $37,962 | $221,209 |
| 2024 | $2,215 | $187,551 | $37,645 | $149,906 |
| 2023 | $2,204 | $187,551 | $37,645 | $149,906 |
| 2022 | $2,110 | $187,551 | $37,645 | $149,906 |
| 2021 | $2,121 | $187,551 | $37,645 | $149,906 |
| 2020 | $1,832 | $157,344 | $44,289 | $113,055 |
| 2019 | $1,832 | $157,344 | $44,289 | $113,055 |
| 2018 | $1,830 | $157,344 | $44,289 | $113,055 |
| 2017 | $1,821 | $157,344 | $44,289 | $113,055 |
| 2016 | $1,828 | $157,344 | $44,289 | $113,055 |
| 2015 | $1,660 | $146,522 | $36,907 | $109,615 |
| 2014 | $1,660 | $146,522 | $36,907 | $109,615 |
Source: Public Records
Map
Nearby Homes