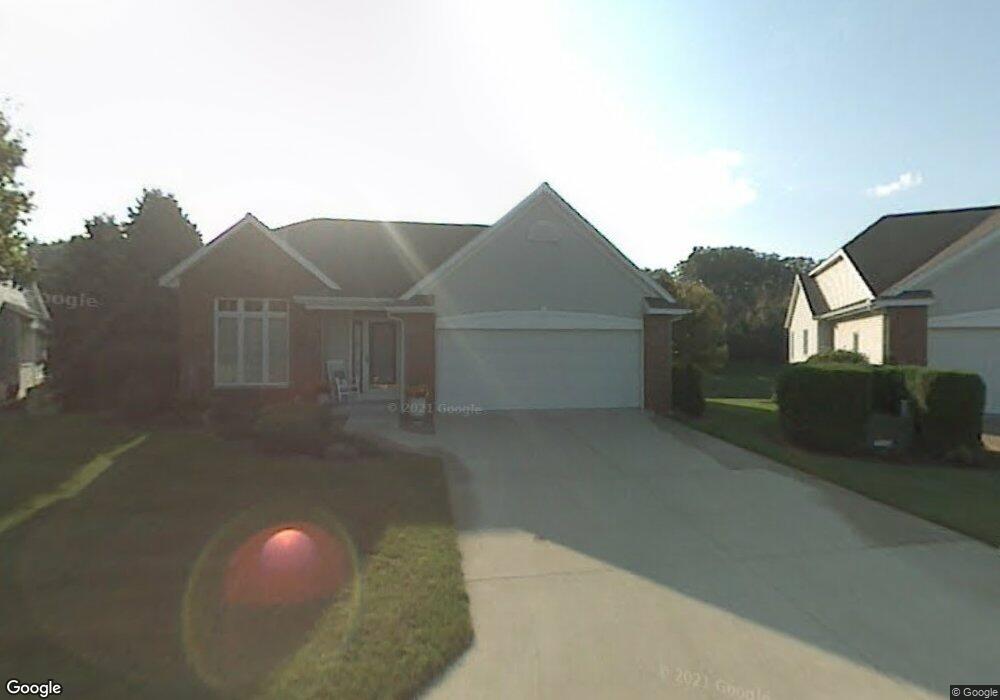
801 Holly Creek Dr Unit 11 Holland, MI 49423
Maplewood NeighborhoodEstimated Value: $347,543 - $393,000
2
Beds
3
Baths
2,339
Sq Ft
$158/Sq Ft
Est. Value
About This Home
This home is located at 801 Holly Creek Dr Unit 11, Holland, MI 49423 and is currently estimated at $370,136, approximately $158 per square foot. 801 Holly Creek Dr Unit 11 is a home located in Allegan County with nearby schools including Maplewood, Holland Middle School, and Holland High School.
Ownership History
Date
Name
Owned For
Owner Type
Purchase Details
Closed on
Mar 9, 2023
Sold by
Kruithoff Randall and Kruithoff Yvonne
Bought by
Randy And Yvonne Kruithoff Joint Trust
Current Estimated Value
Purchase Details
Closed on
Mar 4, 2011
Sold by
Kruithoff Randall and Kruithoff Yvonne
Bought by
Kruithoff Randall and Kruithoff Yvonne
Purchase Details
Closed on
Sep 30, 2005
Sold by
Brink John H
Bought by
Kruithoff Randall and Kruithoff Yvonne
Purchase Details
Closed on
Dec 8, 2000
Sold by
Brink John
Bought by
Brink Edith R Trust
Purchase Details
Closed on
Dec 31, 1997
Sold by
Lambers Rolland
Bought by
Brink John
Purchase Details
Closed on
Dec 1, 1995
Bought by
Lambers Rolland J
Purchase Details
Closed on
Nov 21, 1995
Sold by
Kooyers Foster
Bought by
Aukeman Development
Create a Home Valuation Report for This Property
The Home Valuation Report is an in-depth analysis detailing your home's value as well as a comparison with similar homes in the area
Home Values in the Area
Average Home Value in this Area
Purchase History
| Date | Buyer | Sale Price | Title Company |
|---|---|---|---|
| Randy And Yvonne Kruithoff Joint Trust | -- | -- | |
| Kruithoff Randall | -- | None Available | |
| Kruithoff Randall | $180,000 | Lighthouse Title Inc | |
| Brink Edith R Trust | -- | -- | |
| Brink John | -- | -- | |
| Lambers Rolland J | $134,900 | -- | |
| Aukeman Development | -- | -- |
Source: Public Records
Tax History Compared to Growth
Tax History
| Year | Tax Paid | Tax Assessment Tax Assessment Total Assessment is a certain percentage of the fair market value that is determined by local assessors to be the total taxable value of land and additions on the property. | Land | Improvement |
|---|---|---|---|---|
| 2025 | $4,054 | $157,600 | $19,300 | $138,300 |
| 2024 | -- | $149,700 | $18,300 | $131,400 |
| 2023 | $3,768 | $133,900 | $17,500 | $116,400 |
| 2022 | $3,598 | $125,200 | $17,500 | $107,700 |
| 2021 | $3,445 | $125,900 | $19,000 | $106,900 |
| 2020 | $3,431 | $121,200 | $18,000 | $103,200 |
| 2019 | $3,439 | $113,900 | $18,000 | $95,900 |
| 2018 | $3,265 | $105,700 | $18,000 | $87,700 |
| 2017 | $0 | $92,800 | $15,000 | $77,800 |
| 2016 | $0 | $92,800 | $15,000 | $77,800 |
| 2015 | -- | $92,800 | $15,000 | $77,800 |
| 2014 | -- | $79,200 | $11,500 | $67,700 |
| 2013 | -- | $74,400 | $11,500 | $62,900 |
Source: Public Records
Map
Nearby Homes
- 796 Holly Creek Dr
- 840 Harvest Dr Unit 30
- 421 E 32nd St
- 970 Sagewood Ct Unit 4
- 603 Apple Ave
- 202 E 34th St
- 199 E 34th St Unit 10
- 625 Maple Creek Dr Unit 35
- 171 E 37th St
- 317 Maple Creek Ct
- 650 Lincoln Ave
- 195 E 28th St
- 648 Columbia Ave
- 172 E 25th St
- 533 Columbia Ave Unit 152
- 23 E 35th St
- 561 Century Ln
- 551 Century Ln
- 541 Century Ln
- 17 E 39th St
- 805 Holly Creek Dr
- 795 Holly Creek Dr
- 793 Holly Creek Dr
- 808 Holly Creek Dr
- 789 Holly Creek Dr Unit 14
- 804 Holly Creek Dr
- 787 Holly Creek Dr
- 800 Holly Creek Dr
- 783 Holly Creek Dr
- 390 Holly Field Ct
- 384 Holly Field Ct
- 781 Holly Creek Dr
- 376 Holly Field Ct
- 792 Holly Creek Dr Unit 5
- 393 Holly Field Ct Unit 20
- 777 Holly Creek Dr Unit 18
- 788 Holly Creek Dr
- 788 Holly Creek Dr Unit 4
- 839 Harvest Dr
- 843 Harvest Dr Unit 28