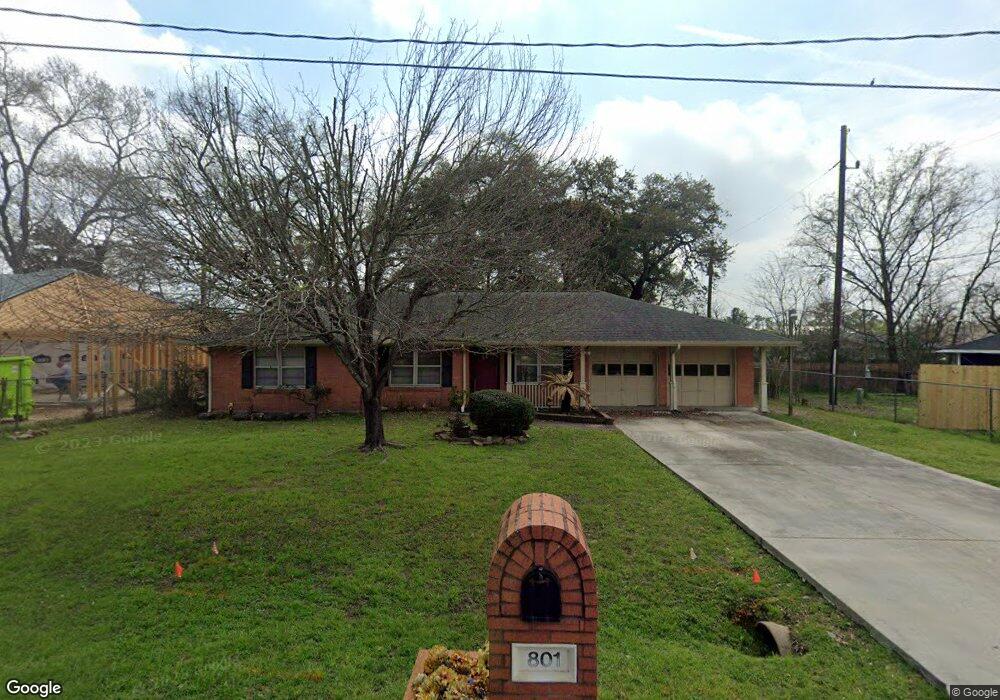
801 Inwood St Tomball, TX 77375
Estimated Value: $298,383 - $371,000
3
Beds
2
Baths
1,696
Sq Ft
$201/Sq Ft
Est. Value
About This Home
This home is located at 801 Inwood St, Tomball, TX 77375 and is currently estimated at $341,346, approximately $201 per square foot. 801 Inwood St is a home located in Harris County with nearby schools including Tomball Elementary School, Tomball Intermediate School, and Tomball Junior High School.
Ownership History
Date
Name
Owned For
Owner Type
Purchase Details
Closed on
May 24, 2022
Sold by
Kowalik Phillips Cindy
Bought by
Phillips Jonathan B and Phillips Jonathan Bryce
Current Estimated Value
Purchase Details
Closed on
Aug 28, 2018
Sold by
Philips Patrick Waymond and Philips Patricik
Bought by
Kowalik Philllips Cindy and Cidny Phillips
Purchase Details
Closed on
Mar 26, 2015
Sold by
Phillips Cindy and Phillips Patrick
Bought by
Jones Ruth Ann and Jones Ralph F
Home Financials for this Owner
Home Financials are based on the most recent Mortgage that was taken out on this home.
Original Mortgage
$104,000
Interest Rate
3.71%
Purchase Details
Closed on
Sep 23, 2013
Sold by
Conn Jimmy L and Conn Debbie L
Bought by
Phillips Cindy and Phillips Patrick
Home Financials for this Owner
Home Financials are based on the most recent Mortgage that was taken out on this home.
Original Mortgage
$104,000
Interest Rate
4.62%
Mortgage Type
New Conventional
Create a Home Valuation Report for This Property
The Home Valuation Report is an in-depth analysis detailing your home's value as well as a comparison with similar homes in the area
Home Values in the Area
Average Home Value in this Area
Purchase History
| Date | Buyer | Sale Price | Title Company |
|---|---|---|---|
| Phillips Jonathan B | -- | Gallagher Victoria H | |
| Kowalik Philllips Cindy | -- | None Available | |
| Jones Ruth Ann | -- | None Available | |
| Phillips Cindy | -- | Frontier Title Co |
Source: Public Records
Mortgage History
| Date | Status | Borrower | Loan Amount |
|---|---|---|---|
| Previous Owner | Jones Ruth Ann | $104,000 | |
| Previous Owner | Phillips Cindy | $104,000 |
Source: Public Records
Tax History Compared to Growth
Tax History
| Year | Tax Paid | Tax Assessment Tax Assessment Total Assessment is a certain percentage of the fair market value that is determined by local assessors to be the total taxable value of land and additions on the property. | Land | Improvement |
|---|---|---|---|---|
| 2025 | $878 | $295,882 | $47,520 | $248,362 |
| 2024 | $878 | $296,937 | $47,520 | $249,417 |
| 2023 | $878 | $261,859 | $47,520 | $214,339 |
| 2022 | $4,998 | $221,708 | $32,832 | $188,876 |
| 2021 | $5,258 | $221,708 | $32,832 | $188,876 |
| 2020 | $5,007 | $204,132 | $30,240 | $173,892 |
| 2019 | $4,711 | $212,864 | $30,240 | $182,624 |
| 2018 | $1,281 | $195,590 | $28,944 | $166,646 |
| 2017 | $3,889 | $195,590 | $28,944 | $166,646 |
| 2016 | $3,536 | $179,005 | $28,944 | $150,061 |
| 2015 | $1,875 | $127,561 | $21,600 | $105,961 |
| 2014 | $1,875 | $137,835 | $21,600 | $116,235 |
Source: Public Records
Map
Nearby Homes
- 1126 Audrey Trail
- 204 Vernon St
- 200 S Vernon St
- 20734 Open Range Ct
- 18818 Cornelia Fields Ln
- 18723 Buttercup Farms Ln
- 20718 Open Range Ct
- 19951 Epona Creek Dr
- 19935 Epona Creek Dr
- 18707 Buttercup Farms Ln
- 20710 Open Range Ct
- 18826 Cornelia Fields Ln
- 20714 Open Range Ct
- 16623 Farm To Market 2920
- 0 Fm-2920
- 504 Percival St Unit A
- 505 Percival St
- 1602 Alpine Dr
- 516 Clayton St
- TBD Clayton St