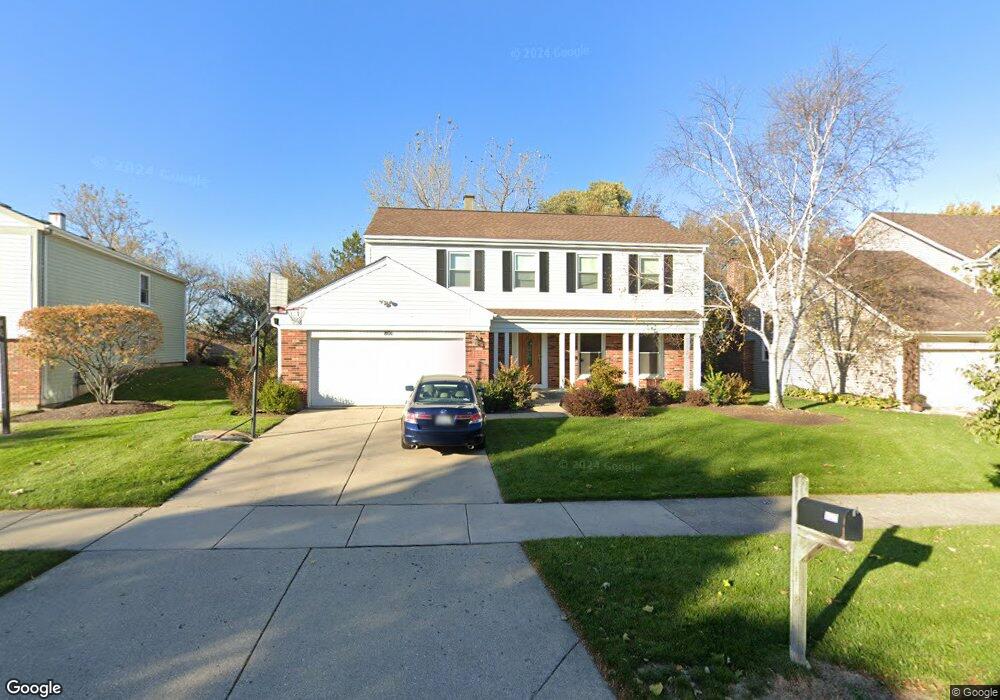
801 Kingsbridge Way Unit 2 Buffalo Grove, IL 60089
Prairie Park-Lake County NeighborhoodEstimated Value: $567,000 - $616,000
--
Bed
3
Baths
2,463
Sq Ft
$241/Sq Ft
Est. Value
About This Home
This home is located at 801 Kingsbridge Way Unit 2, Buffalo Grove, IL 60089 and is currently estimated at $594,318, approximately $241 per square foot. 801 Kingsbridge Way Unit 2 is a home located in Lake County with nearby schools including Prairie Elementary School, Twin Groves Middle School, and Adlai E Stevenson High School.
Ownership History
Date
Name
Owned For
Owner Type
Purchase Details
Closed on
Nov 4, 2019
Sold by
Kallis Melissa Ann and Kallis Jeffrey Scott
Bought by
Kallis Melissa Ann and Melissa Ann Kallis Trust
Current Estimated Value
Purchase Details
Closed on
Dec 26, 2006
Sold by
Christensen Eric V and Christensen Melissa A
Bought by
Christensen Melissa A
Purchase Details
Closed on
Jul 24, 1998
Sold by
Doyle Robert S and Mcphee Kathleen
Bought by
Christensen Eric and Christensen Melissa
Home Financials for this Owner
Home Financials are based on the most recent Mortgage that was taken out on this home.
Original Mortgage
$174,650
Outstanding Balance
$35,834
Interest Rate
7.03%
Estimated Equity
$558,484
Purchase Details
Closed on
Oct 14, 1994
Sold by
Karlin Sidney A and Karlin Robin C
Bought by
Doyle Robert S and Mcphee Kathleen
Home Financials for this Owner
Home Financials are based on the most recent Mortgage that was taken out on this home.
Original Mortgage
$238,400
Interest Rate
8.53%
Create a Home Valuation Report for This Property
The Home Valuation Report is an in-depth analysis detailing your home's value as well as a comparison with similar homes in the area
Home Values in the Area
Average Home Value in this Area
Purchase History
| Date | Buyer | Sale Price | Title Company |
|---|---|---|---|
| Kallis Melissa Ann | -- | Attorney | |
| Christensen Melissa A | -- | None Available | |
| Christensen Eric | $249,500 | -- | |
| Doyle Robert S | $251,000 | Republic Title Company |
Source: Public Records
Mortgage History
| Date | Status | Borrower | Loan Amount |
|---|---|---|---|
| Open | Christensen Eric | $174,650 | |
| Previous Owner | Doyle Robert S | $238,400 |
Source: Public Records
Tax History Compared to Growth
Tax History
| Year | Tax Paid | Tax Assessment Tax Assessment Total Assessment is a certain percentage of the fair market value that is determined by local assessors to be the total taxable value of land and additions on the property. | Land | Improvement |
|---|---|---|---|---|
| 2024 | $16,173 | $184,353 | $37,314 | $147,039 |
| 2023 | $14,877 | $165,667 | $33,532 | $132,135 |
| 2022 | $14,877 | $148,670 | $30,092 | $118,578 |
| 2021 | $14,314 | $147,067 | $29,768 | $117,299 |
| 2020 | $13,976 | $147,569 | $29,870 | $117,699 |
| 2019 | $13,783 | $147,025 | $29,760 | $117,265 |
| 2018 | $7,003 | $144,225 | $29,414 | $114,811 |
| 2017 | $12,847 | $140,858 | $28,727 | $112,131 |
| 2016 | $12,514 | $134,882 | $27,508 | $107,374 |
| 2015 | $12,187 | $126,140 | $25,725 | $100,415 |
| 2014 | $11,472 | $117,467 | $27,629 | $89,838 |
| 2012 | $11,389 | $117,702 | $27,684 | $90,018 |
Source: Public Records
Map
Nearby Homes
- 890 Knollwood Dr
- 327 Lasalle Ln
- 1546 Brandywyn Ln
- 614 Lyon Ct
- 1265 Devonshire Rd
- 538 Lasalle Ct
- 1032 Courtland Dr Unit 9
- 437 Caren Dr
- 1141 Devonshire Rd
- 1903 Sheridan Rd
- 5107 N Arlington Heights Rd
- 1118 Larraway Dr
- 1901 Brandywyn Ln
- 950 Belmar Ln
- 931 Shady Grove Ln
- 1998 Sheridan Ct
- 1113 Lockwood Dr
- 12 Cloverdale Ct
- 1324 Fairfax Ln Unit B32
- 1325 Fairfax Ln
- 791 Kingsbridge Way
- 805 Kingsbridge Way
- 781 Kingsbridge Way
- 811 Kingsbridge Way
- 790 Kingsbridge Way
- 810 Kingsbridge Way
- 771 Kingsbridge Way
- 780 Kingsbridge Way Unit 2
- 5189 Eastgate Ln
- 770 Kingsbridge Way
- 791 Heatherdown Way Unit 2
- 820 Kingsbridge Way
- 761 Kingsbridge Way
- 5188 Eastgate Ln
- 801 Heatherdown Way Unit 2
- 781 Heatherdown Way
- 760 Kingsbridge Way
- 817 Kingsbridge Way
- 830 Kingsbridge Way
- 771 Heatherdown Way