Estimated Value: $400,171 - $489,000
3
Beds
4
Baths
2,576
Sq Ft
$169/Sq Ft
Est. Value
About This Home
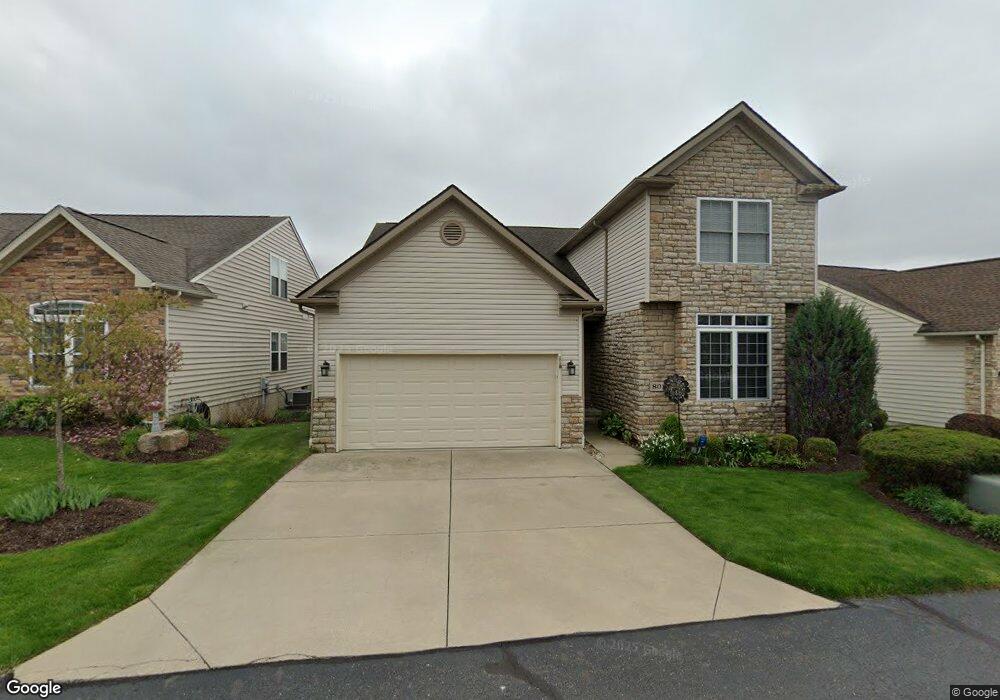
This home is located at 801 Lakeview Ct Unit 3, Kent, OH 44240 and is currently estimated at $436,043, approximately $169 per square foot. 801 Lakeview Ct Unit 3 is a home located in Portage County with nearby schools including Brimfield Elementary School, Field Middle School, and Field High School.
Ownership History
Date
Name
Owned For
Owner Type
Purchase Details
Closed on
Oct 1, 2019
Sold by
Washington Albert L and Spates Kamesha S
Bought by
Zhang Cheng
Current Estimated Value
Home Financials for this Owner
Home Financials are based on the most recent Mortgage that was taken out on this home.
Original Mortgage
$202,400
Outstanding Balance
$174,945
Interest Rate
3.5%
Mortgage Type
New Conventional
Estimated Equity
$261,098
Purchase Details
Closed on
May 5, 2015
Sold by
Daniels Dan N
Bought by
Washington Albert L and Spates Kamesha S
Home Financials for this Owner
Home Financials are based on the most recent Mortgage that was taken out on this home.
Original Mortgage
$217,550
Interest Rate
3.68%
Mortgage Type
New Conventional
Purchase Details
Closed on
May 9, 2013
Sold by
Capstone Resdev Llc
Bought by
Daniels Dan N
Home Financials for this Owner
Home Financials are based on the most recent Mortgage that was taken out on this home.
Original Mortgage
$162,000
Interest Rate
3.56%
Mortgage Type
New Conventional
Create a Home Valuation Report for This Property
The Home Valuation Report is an in-depth analysis detailing your home's value as well as a comparison with similar homes in the area
Home Values in the Area
Average Home Value in this Area
Purchase History
| Date | Buyer | Sale Price | Title Company |
|---|---|---|---|
| Zhang Cheng | $253,000 | None Available | |
| Washington Albert L | $229,000 | Bennett Land Title Agency | |
| Daniels Dan N | $180,000 | None Available |
Source: Public Records
Mortgage History
| Date | Status | Borrower | Loan Amount |
|---|---|---|---|
| Open | Zhang Cheng | $202,400 | |
| Previous Owner | Washington Albert L | $217,550 | |
| Previous Owner | Daniels Dan N | $162,000 |
Source: Public Records
Tax History
| Year | Tax Paid | Tax Assessment Tax Assessment Total Assessment is a certain percentage of the fair market value that is determined by local assessors to be the total taxable value of land and additions on the property. | Land | Improvement |
|---|---|---|---|---|
| 2025 | $6,300 | $131,250 | $9,100 | $122,150 |
| 2024 | $6,195 | $131,250 | $9,100 | $122,150 |
| 2023 | $5,671 | $96,670 | $9,100 | $87,570 |
| 2022 | $5,688 | $96,670 | $9,100 | $87,570 |
| 2021 | $5,556 | $96,670 | $9,100 | $87,570 |
| 2020 | $5,571 | $87,290 | $9,100 | $78,190 |
| 2019 | $5,489 | $87,290 | $9,100 | $78,190 |
| 2018 | $4,082 | $76,720 | $8,750 | $67,970 |
| 2017 | $4,082 | $76,720 | $8,750 | $67,970 |
| 2016 | $4,074 | $76,720 | $8,750 | $67,970 |
| 2015 | $3,969 | $76,720 | $8,750 | $67,970 |
| 2014 | $3,803 | $76,720 | $8,750 | $67,970 |
| 2013 | $3,084 | $61,880 | $8,750 | $53,130 |
Source: Public Records
Map
Nearby Homes
- 4595 Creekside Dr
- 4545 State Route 43
- 0 Progress Blvd Unit LotWP001
- 5088 Spruce Knoll Run
- 1233 Cedar Ridge Rd
- 5096 Spruce Knoll Run
- 4360 Beal Dr
- 410 Beryl Dr
- 0 Meloy Rd Unit 5162435
- 3929 Lor Ron St
- 3880 Selnik Rd
- 32 Picadilly Ct
- 1302 Walnut St
- 124 Tallmadge Rd
- 112 Tallmadge Rd
- 146 Reserve Dr
- 1204 Franklin Ave
- 0 S Water St
- 1676 Countryview Dr
- 1680 Countryview Dr
- 801 Lakeview Ct
- 805 Lakeview Ct Unit 4
- 797 Lakeview Ct Unit 2
- 809 Lakeview Ct Unit 5
- 793 Lakeview Ct Unit 1
- 802 Lakeview Ct Unit 31
- 806 Lakeview Ct Unit 30
- 798 Lakeview Ct
- 810 Lakeview Ct Unit 29
- 813 Lakeview Ct Unit 6
- 814 Lakeview Ct
- 794 Lakeview Ct
- 790 Lakeview Ct
- 817 Lakeview Ct Unit 7
- 818 Lakeview Ct
- 4681 Glenview Ct
- 821 Lakeview Ct Unit 8
- V/L E Howe Rd
- 791 Covington Oval
- 4685 Glenview Ct Unit 25
Your Personal Tour Guide
Ask me questions while you tour the home.