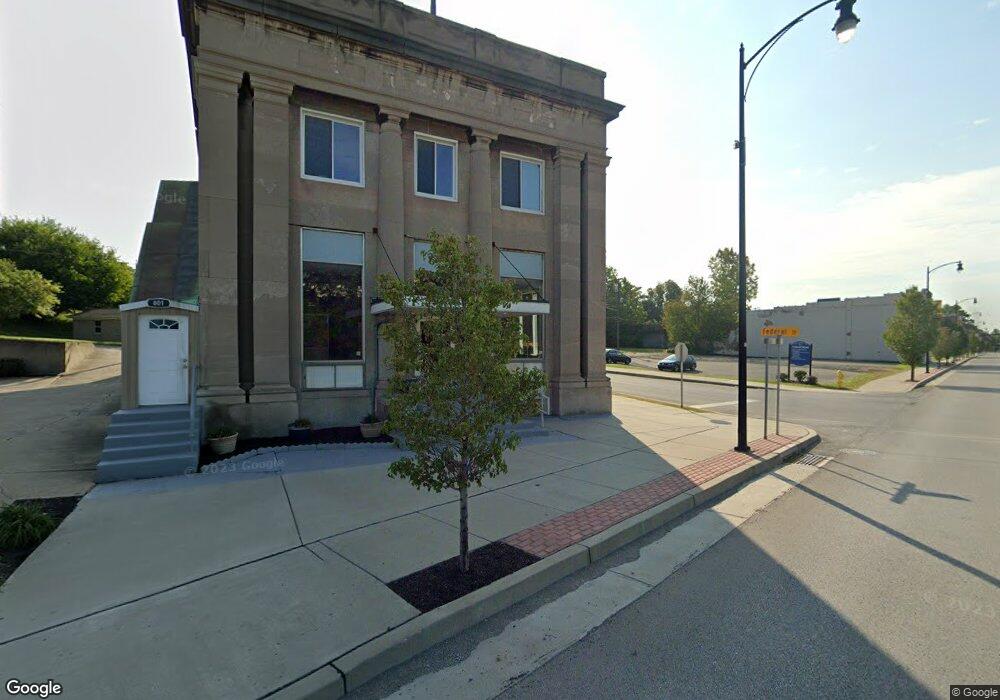
801 Martin Luther King jr Blvd Farrell, PA 16121
Estimated Value: $50,744 - $80,000
--
Bed
--
Bath
875
Sq Ft
$74/Sq Ft
Est. Value
About This Home
This home is located at 801 Martin Luther King jr Blvd, Farrell, PA 16121 and is currently estimated at $64,686, approximately $73 per square foot. 801 Martin Luther King jr Blvd is a home located in Mercer County with nearby schools including Farrell Area Elementary School, Farrell Area High School, and Shenango Valley Faith Academy.
Ownership History
Date
Name
Owned For
Owner Type
Purchase Details
Closed on
Jul 24, 2025
Sold by
Horbatuck George
Bought by
Family Lease Llc
Current Estimated Value
Purchase Details
Closed on
May 23, 2023
Sold by
Slee Todd
Bought by
Family Lease Llc
Purchase Details
Closed on
Nov 8, 2021
Sold by
Eastside Properties Llc
Bought by
Family Lease Llc
Purchase Details
Closed on
Oct 10, 2019
Sold by
Family Lease Llc
Bought by
Slee Todd and Clokey Samantha
Home Financials for this Owner
Home Financials are based on the most recent Mortgage that was taken out on this home.
Original Mortgage
$43,400
Interest Rate
11.75%
Mortgage Type
Land Contract Argmt. Of Sale
Purchase Details
Closed on
Oct 3, 2011
Sold by
Mirizio Joseph R and Franek Joseph A
Bought by
Lowery Michael H
Create a Home Valuation Report for This Property
The Home Valuation Report is an in-depth analysis detailing your home's value as well as a comparison with similar homes in the area
Home Values in the Area
Average Home Value in this Area
Purchase History
| Date | Buyer | Sale Price | Title Company |
|---|---|---|---|
| Family Lease Llc | -- | None Listed On Document | |
| Family Lease Llc | -- | None Listed On Document | |
| Family Lease Llc | $35,972 | None Listed On Document | |
| Slee Todd | $44,900 | None Available | |
| Lowery Michael H | $4,000 | None Available |
Source: Public Records
Mortgage History
| Date | Status | Borrower | Loan Amount |
|---|---|---|---|
| Previous Owner | Slee Todd | $43,400 |
Source: Public Records
Tax History Compared to Growth
Tax History
| Year | Tax Paid | Tax Assessment Tax Assessment Total Assessment is a certain percentage of the fair market value that is determined by local assessors to be the total taxable value of land and additions on the property. | Land | Improvement |
|---|---|---|---|---|
| 2025 | $1,053 | $9,900 | $1,050 | $8,850 |
| 2024 | $1,053 | $9,900 | $1,050 | $8,850 |
| 2023 | $1,249 | $9,900 | $1,050 | $8,850 |
| 2022 | $1,210 | $9,900 | $1,050 | $8,850 |
| 2021 | $1,210 | $9,900 | $1,050 | $8,850 |
| 2020 | $1,219 | $9,900 | $1,050 | $8,850 |
| 2019 | $1,193 | $9,900 | $1,050 | $8,850 |
| 2018 | $1,188 | $9,900 | $1,050 | $8,850 |
| 2017 | $1,156 | $9,900 | $1,050 | $8,850 |
| 2016 | -- | $9,900 | $1,050 | $8,850 |
| 2015 | -- | $9,900 | $1,050 | $8,850 |
| 2014 | -- | $9,900 | $1,050 | $8,850 |
Source: Public Records
Map
Nearby Homes
- 807 Lee Ave
- 306 Federal St
- 626 Fruit Ave
- 506 Spearman Ave
- 641 Fruit Ave
- 715 Hamilton Ave
- 1120 Wallis Ave
- 800 Roemer Blvd
- 1114 Hamilton Ave
- 1125 Hamilton Ave
- 1234 Baldwin Ave
- 1127 Hamilton Ave
- 411 Emerson Ave
- 1131 Hamilton Ave
- 1097 Cedar Ave
- 1107 Emerson Ave
- 414 Hoon Ave
- 268 Malleable St
- 300 Beechwood Ave
- 104 Fruit Ave
- 801 Pennsylvania 718
- 801 Martin Luther King jr Blvd
- 801 Broadway Ave
- 821 Broadway Ave
- 823 Martin Luther King jr Blvd
- 731 M L K Jr Blvd
- 802 Lee Ave
- 719 Mid Ave
- 714 Martin Luther King jr Blvd
- 717 Mid Ave
- 911 Market Ave
- 713 Martin Luther King jr Blvd
- 712 Martin Luther King jr Blvd
- 724 Lee Ave
- 900 Lee Ave
- 821 Lee Ave
- 718 Lee Ave
- 817 Lee Ave
- 819 Lee Ave
- 716 Lee Ave