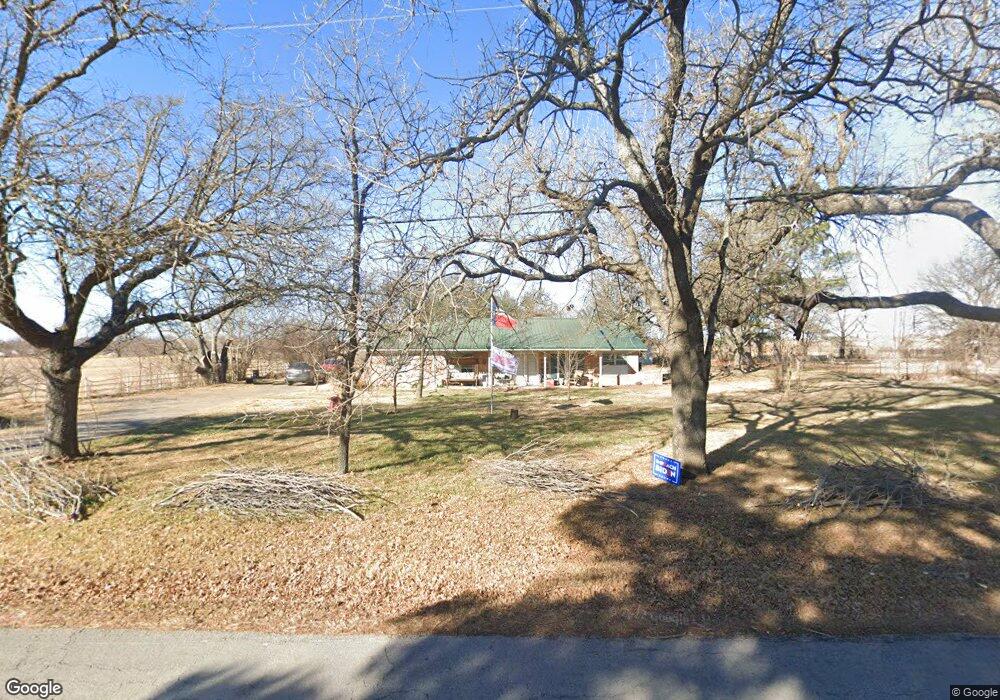
801 N Avenue E Springtown, TX 76082
Estimated Value: $381,000 - $469,000
Studio
--
Bath
2,744
Sq Ft
$155/Sq Ft
Est. Value
About This Home
This home is located at 801 N Avenue E, Springtown, TX 76082 and is currently estimated at $423,950, approximately $154 per square foot. 801 N Avenue E is a home located in Parker County with nearby schools including Springtown Elementary School, Springtown Intermediate School, and Springtown Middle School.
Ownership History
Date
Name
Owned For
Owner Type
Purchase Details
Closed on
Mar 1, 2013
Sold by
Brister Douglas E and Brister Elizabeth J
Bought by
Jones Herbert Russell and Eugenia Marie
Current Estimated Value
Purchase Details
Closed on
Feb 5, 2013
Sold by
Brister Douglas E and Brister Elizabeth J
Bought by
Jones Herbert Russell and Jones Eugenia Marie
Purchase Details
Closed on
Jul 8, 1999
Sold by
Hughes Clifton D
Bought by
Jones Herbert Russell and Eugenia Marie
Create a Home Valuation Report for This Property
The Home Valuation Report is an in-depth analysis detailing your home's value as well as a comparison with similar homes in the area
Home Values in the Area
Average Home Value in this Area
Purchase History
| Date | Buyer | Sale Price | Title Company |
|---|---|---|---|
| Jones Herbert Russell | -- | -- | |
| Jones Herbert Russell | $150,000 | None Available | |
| Jones Herbert Russell | -- | -- |
Source: Public Records
Mortgage History
| Date | Status | Borrower | Loan Amount |
|---|---|---|---|
| Closed | Jones Herbert Russell | $0 |
Source: Public Records
Tax History
| Year | Tax Paid | Tax Assessment Tax Assessment Total Assessment is a certain percentage of the fair market value that is determined by local assessors to be the total taxable value of land and additions on the property. | Land | Improvement |
|---|---|---|---|---|
| 2025 | $5,229 | $348,976 | -- | -- |
| 2024 | $5,229 | $317,251 | -- | -- |
| 2023 | $5,229 | $288,410 | $0 | $0 |
| 2022 | $5,954 | $269,720 | $70,000 | $199,720 |
| 2021 | $5,962 | $269,720 | $70,000 | $199,720 |
| 2020 | $5,398 | $230,060 | $50,000 | $180,060 |
| 2019 | $5,241 | $230,060 | $50,000 | $180,060 |
Source: Public Records
Map
Nearby Homes
Your Personal Tour Guide
Ask me questions while you tour the home.