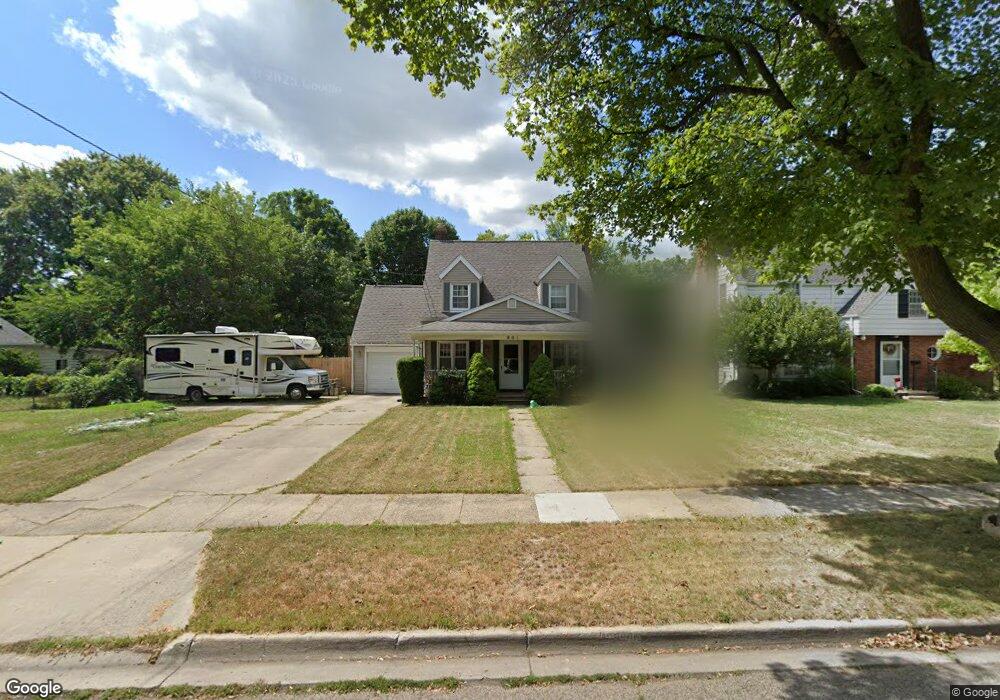
801 N Foster Ave Lansing, MI 48912
Foster NeighborhoodEstimated Value: $218,000 - $239,000
--
Bed
1
Bath
1,500
Sq Ft
$153/Sq Ft
Est. Value
About This Home
This home is located at 801 N Foster Ave, Lansing, MI 48912 and is currently estimated at $228,758, approximately $152 per square foot. 801 N Foster Ave is a home located in Ingham County with nearby schools including Pattengill Academy, Willow School, and Eastern Lansing High School.
Ownership History
Date
Name
Owned For
Owner Type
Purchase Details
Closed on
Nov 5, 2012
Sold by
Davis Linda L
Bought by
Davis Amylou and Davis Linda L
Current Estimated Value
Home Financials for this Owner
Home Financials are based on the most recent Mortgage that was taken out on this home.
Original Mortgage
$86,000
Outstanding Balance
$37,521
Interest Rate
3.32%
Mortgage Type
New Conventional
Estimated Equity
$191,237
Purchase Details
Closed on
Nov 26, 2002
Sold by
Mccreight James D E
Bought by
Davis Linda L
Home Financials for this Owner
Home Financials are based on the most recent Mortgage that was taken out on this home.
Original Mortgage
$110,550
Interest Rate
6.23%
Mortgage Type
Purchase Money Mortgage
Purchase Details
Closed on
Nov 15, 1999
Sold by
Mccreight James D E and Mccreight Mary G
Bought by
Mccreight James D E
Create a Home Valuation Report for This Property
The Home Valuation Report is an in-depth analysis detailing your home's value as well as a comparison with similar homes in the area
Home Values in the Area
Average Home Value in this Area
Purchase History
| Date | Buyer | Sale Price | Title Company |
|---|---|---|---|
| Davis Amylou | -- | None Available | |
| Davis Linda L | $130,100 | Transnation | |
| Mccreight James D E | -- | First American Title Ins Co |
Source: Public Records
Mortgage History
| Date | Status | Borrower | Loan Amount |
|---|---|---|---|
| Open | Davis Amylou | $86,000 | |
| Closed | Davis Linda L | $110,550 |
Source: Public Records
Tax History Compared to Growth
Tax History
| Year | Tax Paid | Tax Assessment Tax Assessment Total Assessment is a certain percentage of the fair market value that is determined by local assessors to be the total taxable value of land and additions on the property. | Land | Improvement |
|---|---|---|---|---|
| 2025 | $4,872 | $114,900 | $19,200 | $95,700 |
| 2024 | $39 | $102,900 | $19,200 | $83,700 |
| 2023 | $4,565 | $94,200 | $19,200 | $75,000 |
| 2022 | $4,110 | $86,800 | $15,800 | $71,000 |
| 2021 | $4,024 | $80,000 | $15,400 | $64,600 |
| 2020 | $4,000 | $76,500 | $15,400 | $61,100 |
| 2019 | $3,838 | $73,000 | $15,400 | $57,600 |
| 2018 | $3,592 | $66,900 | $15,400 | $51,500 |
| 2017 | $3,440 | $66,900 | $15,400 | $51,500 |
| 2016 | $3,319 | $62,000 | $15,400 | $46,600 |
| 2015 | $3,319 | $60,300 | $30,746 | $29,554 |
| 2014 | $3,319 | $59,900 | $22,608 | $37,292 |
Source: Public Records
Map
Nearby Homes
- 811 N Foster Ave
- 628 N Magnolia Ave
- 623 N Magnolia Ave
- 825 Merrill Ave
- 435 N Magnolia Ave
- 422 N Magnolia Ave
- 417 N Francis Ave
- 1043 Kimberly Dr Unit 11
- 324 N Francis Ave
- 318 N Foster Ave
- 1226 N Hayford Ave
- 221 N Francis Ave
- 1204 Chester Rd
- 212 N Fairview Ave
- 2808 Lasalle Gardens
- 2635 Lasalle Blvd
- 204 N Fairview Ave
- 2711 Lasalle Blvd
- 941 Maryland Ave
- 118 Mifflin Ave
- 807 N Foster Ave
- 727 N Foster Ave
- 800 N Hayford Ave
- 732 N Hayford Ave
- 804 N Hayford Ave
- 806 N Hayford Ave
- 730 N Hayford Ave
- 721 N Foster Ave
- 810 N Hayford Ave
- 724 N Hayford Ave
- 730 N Foster Ave
- 806 N Foster Ave
- 717 N Foster Ave
- 722 N Hayford Ave
- 816 N Hayford Ave
- 726 N Foster Ave
- 812 N Foster Ave
- 718 N Hayford Ave
- 821 N Foster Ave
- 720 N Foster Ave