The Plaza Condominium 801 N Howard St Unit 208 Alexandria, VA 22304
Seminary Hill NeighborhoodEstimated Value: $336,994 - $363,000
2
Beds
2
Baths
1,016
Sq Ft
$342/Sq Ft
Est. Value
About This Home
This home is located at 801 N Howard St Unit 208, Alexandria, VA 22304 and is currently estimated at $347,665, approximately $342 per square foot. 801 N Howard St Unit 208 is a home located in Alexandria City with nearby schools including Patrick Henry Elementary School, Alexandria City High School, and Guidepost Montessori at West Alex.
Ownership History
Date
Name
Owned For
Owner Type
Purchase Details
Closed on
Feb 27, 2006
Sold by
Holden Richard E
Bought by
Hannan John R
Current Estimated Value
Home Financials for this Owner
Home Financials are based on the most recent Mortgage that was taken out on this home.
Original Mortgage
$280,000
Outstanding Balance
$158,244
Interest Rate
6.17%
Mortgage Type
New Conventional
Estimated Equity
$189,421
Create a Home Valuation Report for This Property
The Home Valuation Report is an in-depth analysis detailing your home's value as well as a comparison with similar homes in the area
Home Values in the Area
Average Home Value in this Area
Purchase History
| Date | Buyer | Sale Price | Title Company |
|---|---|---|---|
| Hannan John R | $35,000 | -- |
Source: Public Records
Mortgage History
| Date | Status | Borrower | Loan Amount |
|---|---|---|---|
| Open | Hannan John R | $280,000 |
Source: Public Records
Tax History Compared to Growth
Tax History
| Year | Tax Paid | Tax Assessment Tax Assessment Total Assessment is a certain percentage of the fair market value that is determined by local assessors to be the total taxable value of land and additions on the property. | Land | Improvement |
|---|---|---|---|---|
| 2025 | $3,812 | $334,213 | $123,085 | $211,128 |
| 2024 | $3,812 | $328,053 | $120,672 | $207,381 |
| 2023 | $3,463 | $311,993 | $114,381 | $197,612 |
| 2022 | $3,285 | $295,977 | $108,418 | $187,559 |
| 2021 | $3,098 | $279,124 | $103,255 | $175,869 |
| 2020 | $2,963 | $266,784 | $98,338 | $168,446 |
| 2019 | $2,832 | $250,640 | $91,905 | $158,735 |
| 2018 | $2,832 | $250,640 | $91,905 | $158,735 |
| 2017 | $2,832 | $250,640 | $91,905 | $158,735 |
| 2016 | $2,847 | $265,361 | $97,771 | $167,590 |
| 2015 | $2,768 | $265,361 | $97,771 | $167,590 |
| 2014 | $2,628 | $251,944 | $97,771 | $154,173 |
Source: Public Records
About The Plaza Condominium
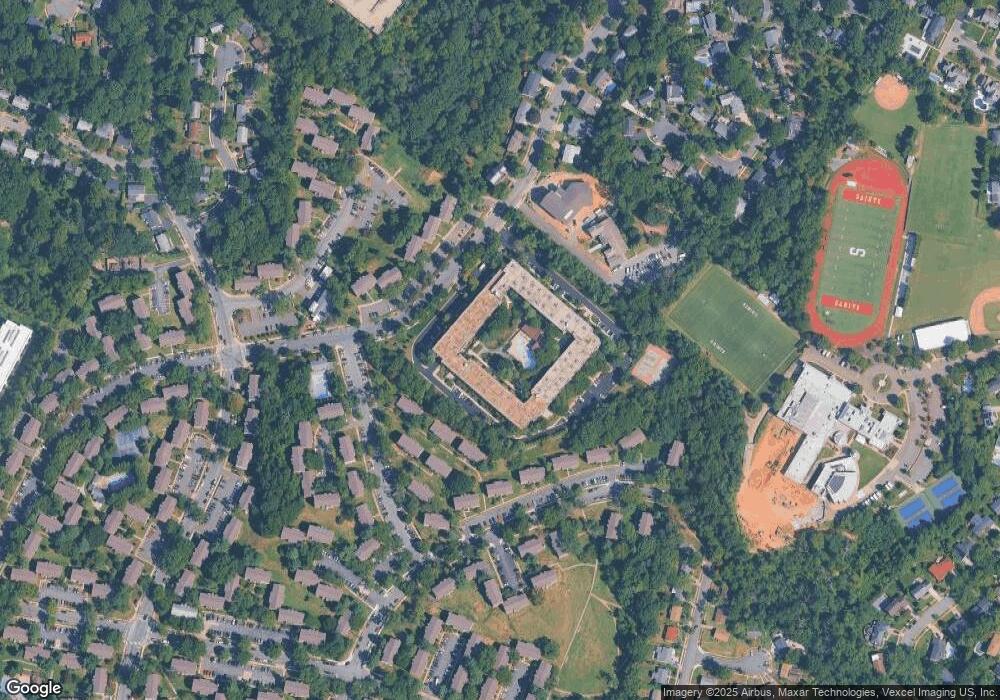
Map
Nearby Homes
- 803 N Howard St Unit 152
- 803 N Howard St Unit 252
- 803 N Howard St Unit 254
- 3968 Fort Worth Ave
- 4532 Peacock Ave
- 1336 N Ivanhoe St
- 4600 Strathblane Place
- 491 N Latham St
- 1101 Finley Ln
- 492 N Latham St
- 33 Underwood Place
- 28 Garden Dr
- 132 N Early St
- 4600 Duke St Unit 921
- 4600 Duke St Unit 1613
- 4600 Duke St Unit 622
- 4600 Duke St Unit 432
- 4600 Duke St Unit 613
- 4600 Duke St Unit 723
- 4600 Duke St Unit 1300
- 801 N Howard St Unit 103
- 801 N Howard St Unit 301
- 801 N Howard St Unit 107
- 801 N Howard St Unit 347
- 801 N Howard St Unit 468
- 801 N Howard St Unit 272
- 801 N Howard St Unit 349
- 801 N Howard St Unit 307
- 801 N Howard St Unit 404
- 801 N Howard St Unit 470
- 801 N Howard St Unit 474
- 801 N Howard St Unit 405
- 801 N Howard St Unit 374
- 801 N Howard St Unit 104
- 801 N Howard St Unit 403
- 801 N Howard St Unit 108
- 801 N Howard St Unit 304
- 801 N Howard St Unit 300
- 801 N Howard St Unit 106
- 801 N Howard St Unit 102