801 N Huntington St Unit 1 Syracuse, IN 46567
Estimated Value: $99,822
--
Bed
--
Bath
1,216
Sq Ft
$82/Sq Ft
Est. Value
About This Home
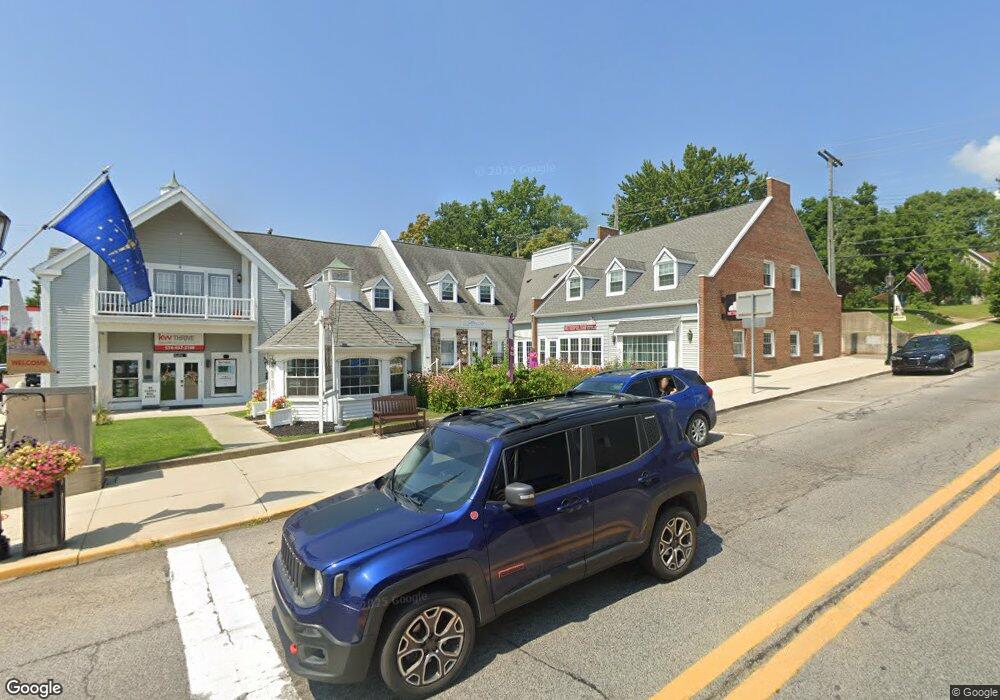
This home is located at 801 N Huntington St Unit 1, Syracuse, IN 46567 and is currently estimated at $99,822, approximately $82 per square foot. 801 N Huntington St Unit 1 is a home located in Kosciusko County with nearby schools including Wawasee High School and PEACEFUL WOODS.
Ownership History
Date
Name
Owned For
Owner Type
Purchase Details
Closed on
Dec 2, 2025
Sold by
Red Jar Group Llc
Bought by
Rocolta Property Holdings Llc
Current Estimated Value
Purchase Details
Closed on
Jun 18, 2024
Sold by
Agri-Nomics Consulting Llc
Bought by
Red Jar Group Llc
Purchase Details
Closed on
Apr 30, 2020
Sold by
Rock Rochelle L
Bought by
Agri Nomics Consulting Llc
Home Financials for this Owner
Home Financials are based on the most recent Mortgage that was taken out on this home.
Original Mortgage
$55,000
Interest Rate
3.5%
Mortgage Type
Commercial
Purchase Details
Closed on
Sep 18, 2018
Sold by
Phillabaum Mark
Bought by
Rock Rochelle L
Purchase Details
Closed on
Dec 2, 2013
Sold by
Landmark Capital Investments Inc
Bought by
Phillabaum Mark
Purchase Details
Closed on
Aug 27, 2013
Sold by
Ja Business Services
Bought by
Landmark Capital Investments Inc
Create a Home Valuation Report for This Property
The Home Valuation Report is an in-depth analysis detailing your home's value as well as a comparison with similar homes in the area
Home Values in the Area
Average Home Value in this Area
Purchase History
| Date | Buyer | Sale Price | Title Company |
|---|---|---|---|
| Rocolta Property Holdings Llc | -- | None Listed On Document | |
| Red Jar Group Llc | $95,000 | None Listed On Document | |
| Agri Nomics Consulting Llc | $55,000 | Fidelity National Title Compan | |
| Rock Rochelle L | -- | Metropolitan Title Of In Llc | |
| Phillabaum Mark | -- | None Available | |
| Landmark Capital Investments Inc | -- | None Available |
Source: Public Records
Mortgage History
| Date | Status | Borrower | Loan Amount |
|---|---|---|---|
| Previous Owner | Agri Nomics Consulting Llc | $55,000 |
Source: Public Records
Tax History Compared to Growth
Tax History
| Year | Tax Paid | Tax Assessment Tax Assessment Total Assessment is a certain percentage of the fair market value that is determined by local assessors to be the total taxable value of land and additions on the property. | Land | Improvement |
|---|---|---|---|---|
| 2024 | $1,315 | $80,100 | $14,600 | $65,500 |
| 2023 | $1,371 | $80,100 | $14,600 | $65,500 |
| 2022 | $1,404 | $78,600 | $14,600 | $64,000 |
| 2021 | $1,403 | $76,600 | $14,000 | $62,600 |
| 2020 | $1,333 | $72,800 | $8,500 | $64,300 |
| 2019 | $1,404 | $72,000 | $8,400 | $63,600 |
| 2018 | $1,357 | $71,200 | $8,100 | $63,100 |
| 2017 | $1,318 | $68,500 | $8,100 | $60,400 |
| 2016 | $1,172 | $67,400 | $8,000 | $59,400 |
| 2014 | $1,139 | $63,400 | $7,500 | $55,900 |
| 2013 | $1,139 | $62,300 | $7,400 | $54,900 |
Source: Public Records
Map
Nearby Homes
- 205 W Washington St
- 901 N Huntington St
- 0 TBD N Huntington St
- 804 N Harrison St
- 300 E Medusa St Unit 5D
- 500 E Medusa St
- 304 E Pickwick Dr
- 510 S Harkless Dr Unit 12
- tbd Huntington
- 700 S Lakeside Dr Unit 8
- 72365 County 133 Rd
- 12967 N Eastshore Dr
- 822 S Lakeside Dr
- 919 S Haug St
- 6001 E Island Ave
- 13426 N Hillside Dr
- 5916 E George St
- 11378 N Nash Dr
- TBD N Grandview Dr
- TBD Lot 39 Placidview Ln
- 801 N Huntington St Unit Suite 10
- 801 N Huntington St
- 103 W Washington St
- 203 W Washington St
- 100 E Main St
- 9157 Indiana 13
- TBD Sr 13 S
- VL Indiana 13
- 105 W Main St
- 103 W Main St
- 101 W Main St
- 201 W Main St
- 14623 S County Rd
- 205 W Main St
- 200 W Washington St
- 207 W Main St
- 708 N Huntington St
- 300 W Main St
- 903 N Huntington St
- 706 N Huntington St Unit Down Town