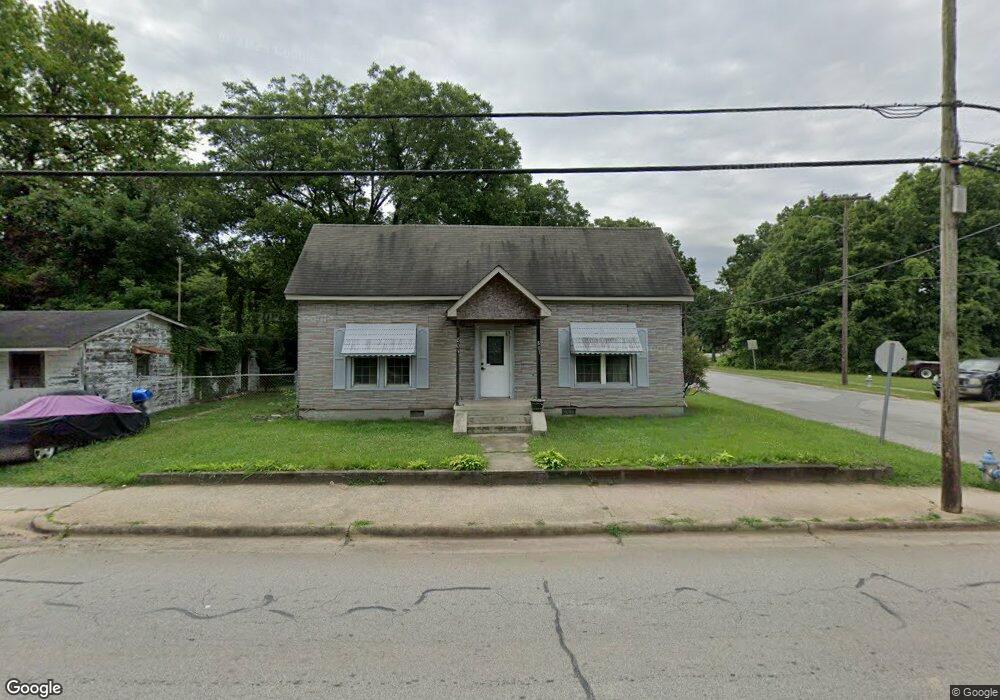
801 N Long St Salisbury, NC 28144
Estimated Value: $115,000 - $233,000
Studio
1
Bath
1,110
Sq Ft
$147/Sq Ft
Est. Value
About This Home
This home is located at 801 N Long St, Salisbury, NC 28144 and is currently estimated at $163,508, approximately $147 per square foot. 801 N Long St is a home located in Rowan County with nearby schools including E Hanford Dole Elementary School, North Rowan Middle School, and North Rowan High School.
Ownership History
Date
Name
Owned For
Owner Type
Purchase Details
Closed on
May 18, 2022
Sold by
Holloway Nieda A and Holloway Eric A
Bought by
Holloway Anthony
Current Estimated Value
Purchase Details
Closed on
May 21, 2021
Sold by
Fleming Deborah L
Bought by
Holloway Nieda
Purchase Details
Closed on
Nov 1, 1980
Bought by
Fleming Deborah Lyerly
Create a Home Valuation Report for This Property
The Home Valuation Report is an in-depth analysis detailing your home's value as well as a comparison with similar homes in the area
Home Values in the Area
Average Home Value in this Area
Purchase History
| Date | Buyer | Sale Price | Title Company |
|---|---|---|---|
| Holloway Anthony | -- | None Listed On Document | |
| Holloway Nieda | -- | None Available | |
| Fleming Deborah Lyerly | $25,000 | -- |
Source: Public Records
Tax History
| Year | Tax Paid | Tax Assessment Tax Assessment Total Assessment is a certain percentage of the fair market value that is determined by local assessors to be the total taxable value of land and additions on the property. | Land | Improvement |
|---|---|---|---|---|
| 2025 | $834 | $67,239 | $28,080 | $39,159 |
| 2024 | $834 | $67,239 | $28,080 | $39,159 |
| 2023 | $533 | $42,997 | $28,080 | $14,917 |
| 2022 | $460 | $34,896 | $23,400 | $11,496 |
| 2021 | $460 | $34,896 | $23,400 | $11,496 |
| 2020 | $460 | $34,896 | $23,400 | $11,496 |
| 2019 | $460 | $34,896 | $23,400 | $11,496 |
| 2018 | $426 | $32,718 | $23,400 | $9,318 |
| 2017 | $417 | $32,718 | $23,400 | $9,318 |
| 2016 | $417 | $32,718 | $23,400 | $9,318 |
| 2015 | $423 | $32,718 | $23,400 | $9,318 |
| 2014 | $417 | $32,542 | $21,840 | $10,702 |
Source: Public Records
Map
Nearby Homes
- 224 E Steele St
- 628 E Lafayette St
- 115 E Steele St
- 505 E Cemetery St
- 113 E Miller St
- 1121 Richard St
- 1008 N Main St
- 200 W Lafayette St
- 127 E 11th St
- 1270 N Shaver St
- 1280 N Shaver St
- 1138 Laurel St
- 915 Reeves St
- 0 Brown St
- 500 W Council St
- 1201 N Church St
- 828 Park Ave
- 205 N Martin Luther King jr Ave
- 1214 Short St
- 122 E Innes St
- 405 Bringle Ferry Rd
- 328 E Henderson St
- 318 E Henderson St
- 721 N Long St
- 437 Bringle Ferry Rd
- 714 N Shaver St
- 424 E Lafayette St
- 430 E Lafayette St
- 503 Bringle Ferry Rd
- 506 Bringle Ferry Rd
- 301 E Henderson Es St
- 305 E Henderson Es St
- 809 N Long St
- 809 N Long St
- 511 Bringle Ferry Rd
- 502 E Lafayette St
- 308 E Henderson St
- 705 S Railroad St
- 519 Bringle Ferry Rd
- 423 E Lafayette St
Your Personal Tour Guide
Ask me questions while you tour the home.