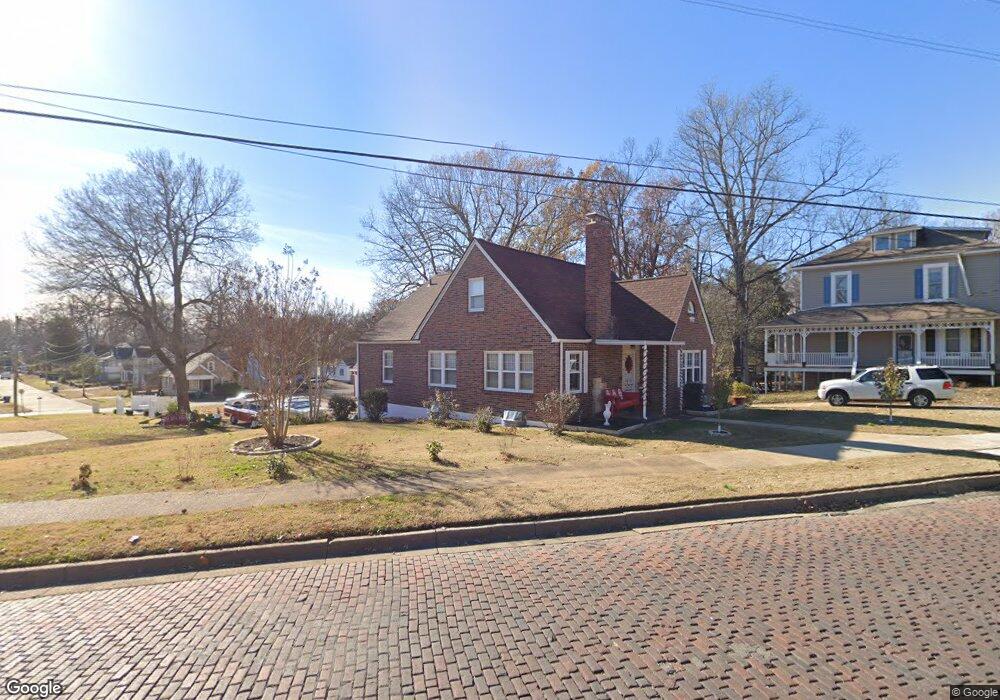
801 N Main St Poplar Bluff, MO 63901
Estimated Value: $106,000 - $160,000
6
Beds
--
Bath
2,432
Sq Ft
$53/Sq Ft
Est. Value
About This Home
This home is located at 801 N Main St, Poplar Bluff, MO 63901 and is currently estimated at $127,746, approximately $52 per square foot. 801 N Main St is a home located in Butler County with nearby schools including Poplar Bluff Fifth & Sixth Grade Center, O'Neal Elementary School, and Poplar Bluff Junior High School.
Ownership History
Date
Name
Owned For
Owner Type
Purchase Details
Closed on
Dec 15, 2023
Sold by
Ethridge John Eugene and Ethridge Jan Donnella
Bought by
Ethridge John Eugene and Ethridge Jan Donnella
Current Estimated Value
Purchase Details
Closed on
Feb 2, 2010
Sold by
Wilson Helen Jane and Hansbrough Jane Wilson
Bought by
Ethridge John Eugene
Home Financials for this Owner
Home Financials are based on the most recent Mortgage that was taken out on this home.
Original Mortgage
$73,061
Interest Rate
5.08%
Mortgage Type
New Conventional
Create a Home Valuation Report for This Property
The Home Valuation Report is an in-depth analysis detailing your home's value as well as a comparison with similar homes in the area
Home Values in the Area
Average Home Value in this Area
Purchase History
| Date | Buyer | Sale Price | Title Company |
|---|---|---|---|
| Ethridge John Eugene | -- | None Listed On Document | |
| Ethridge John Eugene | -- | -- |
Source: Public Records
Mortgage History
| Date | Status | Borrower | Loan Amount |
|---|---|---|---|
| Previous Owner | Ethridge John Eugene | $73,061 |
Source: Public Records
Tax History
| Year | Tax Paid | Tax Assessment Tax Assessment Total Assessment is a certain percentage of the fair market value that is determined by local assessors to be the total taxable value of land and additions on the property. | Land | Improvement |
|---|---|---|---|---|
| 2024 | $5 | $10,590 | $0 | $0 |
| 2023 | $512 | $10,590 | $0 | $0 |
| 2022 | $494 | $10,240 | $0 | $0 |
| 2021 | $494 | $10,240 | $0 | $0 |
| 2020 | $461 | $9,430 | $0 | $0 |
| 2019 | $461 | $9,430 | $0 | $0 |
| 2018 | $461 | $9,430 | $0 | $0 |
| 2017 | -- | $9,430 | $0 | $0 |
| 2016 | -- | $9,430 | $0 | $0 |
| 2015 | -- | $9,430 | $0 | $0 |
| 2014 | -- | $8,790 | $0 | $0 |
| 2012 | $376 | $8,830 | $0 | $0 |
Source: Public Records
Map
Nearby Homes
- 813 N Main St
- 916 Nooney St
- 732 Kinzer St
- 305 N 8th St
- 842 Kinzer St
- 1101 N Main St
- 1002 Tremont St
- 719 Mary St
- 948 W Harper St
- 1202 Spring St
- 448 Lester St
- 1106 W Harper St
- 402 W Harper St
- 1103 Lester St
- 938 Poplar St
- 225 S 6th St
- 945 Cedar St
- 1401 Grove St
- 122 S 11th St
- 0 Lot # 26 Westwood Highlands Unit 22057636
Your Personal Tour Guide
Ask me questions while you tour the home.