The Greens of Elgin 801 N Mclean Blvd Unit 10 Elgin, IL 60123
Northeast Elgin NeighborhoodEstimated Value: $66,000 - $67,000
1
Bed
1
Bath
750
Sq Ft
$89/Sq Ft
Est. Value
About This Home
This home is located at 801 N Mclean Blvd Unit 10, Elgin, IL 60123 and is currently estimated at $66,421, approximately $88 per square foot. 801 N Mclean Blvd Unit 10 is a home located in Kane County with nearby schools including Century Oaks Elementary School, Kimball Middle School, and Larkin High School.
Ownership History
Date
Name
Owned For
Owner Type
Purchase Details
Closed on
Apr 26, 2024
Sold by
Kelly Russell Lee
Bought by
Moss Harlon L and Moss Evelyn B
Current Estimated Value
Home Financials for this Owner
Home Financials are based on the most recent Mortgage that was taken out on this home.
Original Mortgage
$55,800
Outstanding Balance
$55,035
Interest Rate
7%
Mortgage Type
New Conventional
Estimated Equity
$11,386
Purchase Details
Closed on
Apr 12, 2022
Sold by
Lowers Randy R
Bought by
Kelly Russell
Purchase Details
Closed on
Jun 27, 2005
Sold by
Windsor Lifecare Llc
Bought by
Conine Louisa J and Flowers Randy R
Home Financials for this Owner
Home Financials are based on the most recent Mortgage that was taken out on this home.
Original Mortgage
$122,400
Interest Rate
5.62%
Mortgage Type
Unknown
Create a Home Valuation Report for This Property
The Home Valuation Report is an in-depth analysis detailing your home's value as well as a comparison with similar homes in the area
Home Values in the Area
Average Home Value in this Area
Purchase History
| Date | Buyer | Sale Price | Title Company |
|---|---|---|---|
| Moss Harlon L | $62,000 | Fidelity National Title | |
| Kelly Russell | $45,000 | Harlovic Nicholas J | |
| Conine Louisa J | $153,000 | Chicago Title Insurance Comp |
Source: Public Records
Mortgage History
| Date | Status | Borrower | Loan Amount |
|---|---|---|---|
| Open | Moss Harlon L | $55,800 | |
| Previous Owner | Conine Louisa J | $122,400 |
Source: Public Records
Tax History Compared to Growth
Tax History
| Year | Tax Paid | Tax Assessment Tax Assessment Total Assessment is a certain percentage of the fair market value that is determined by local assessors to be the total taxable value of land and additions on the property. | Land | Improvement |
|---|---|---|---|---|
| 2024 | -- | $12,959 | $6,480 | $6,479 |
| 2023 | -- | $11,707 | $5,854 | $5,853 |
| 2022 | $635 | $10,675 | $5,338 | $5,337 |
| 2021 | $890 | $9,981 | $4,991 | $4,990 |
| 2020 | $869 | $9,529 | $4,765 | $4,764 |
| 2019 | $848 | $9,077 | $4,539 | $4,538 |
| 2018 | $845 | $8,551 | $4,276 | $4,275 |
| 2017 | $831 | $8,083 | $4,042 | $4,041 |
| 2016 | $800 | $7,499 | $3,750 | $3,749 |
| 2015 | -- | $6,873 | $3,437 | $3,436 |
| 2014 | -- | $16,449 | $3,395 | $13,054 |
| 2013 | -- | $16,883 | $3,485 | $13,398 |
Source: Public Records
About The Greens of Elgin
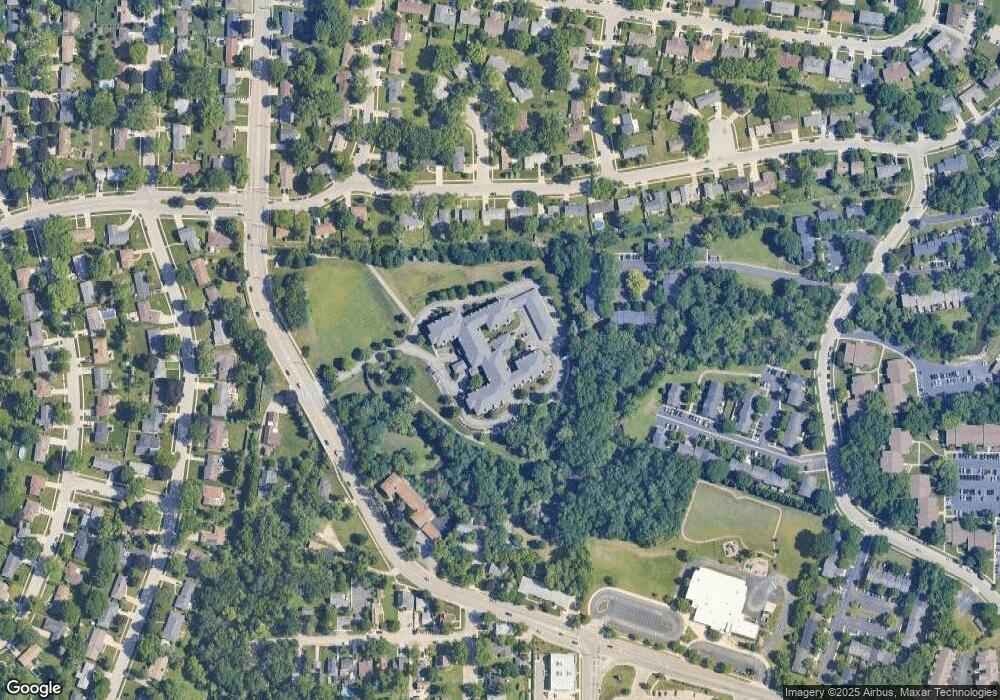
Map
Nearby Homes
- 801 N Mclean Blvd Unit 226
- 801 N Mclean Blvd Unit 316
- 801 N Mclean Blvd Unit 320
- 11 Cypress Square
- 13 Pioneer Park Place
- 587 N Clifton Ave
- 900 Ruth Dr
- 431 N Melrose Ave
- 308 N Clifton Ave
- 520 N Lyle Ave
- 221 Heine Ave
- 518 Clark St
- 1103 Lawrence Ave
- 609 N Lyle Ave
- 938 Hillcrest Rd
- 558 N Crystal St
- 1106 W Highland Ave
- 369 Vincent Place
- 2133 Colorado Ave Unit 1
- 1666 Lin Lor Ct
- 801 N Mclean Blvd Unit 120
- 801 N Mclean Blvd Unit 248
- 801 N Mclean Blvd Unit 208
- 801 N Mclean Blvd Unit 344
- 801 N Mclean Blvd Unit 352
- 801 N Mclean Blvd Unit 310
- 801 N Mclean Blvd Unit 348
- 801 N Mclean Blvd Unit 340
- 801 N Mclean Blvd Unit 306
- 801 N Mclean Blvd Unit 136
- 801 N Mclean Blvd Unit 326
- 801 N Mclean Blvd Unit 314
- 801 N Mclean Blvd Unit 10
- 801 N Mclean Blvd Unit 25
- 801 N Mclean Blvd Unit 25
- 801 N Mclean Blvd Unit 15
- 801 N Mclean Blvd Unit 33
- 801 N Mclean Blvd Unit 20
- 801 N Mclean Blvd Unit 33
- 801 N Mclean Blvd Unit 33