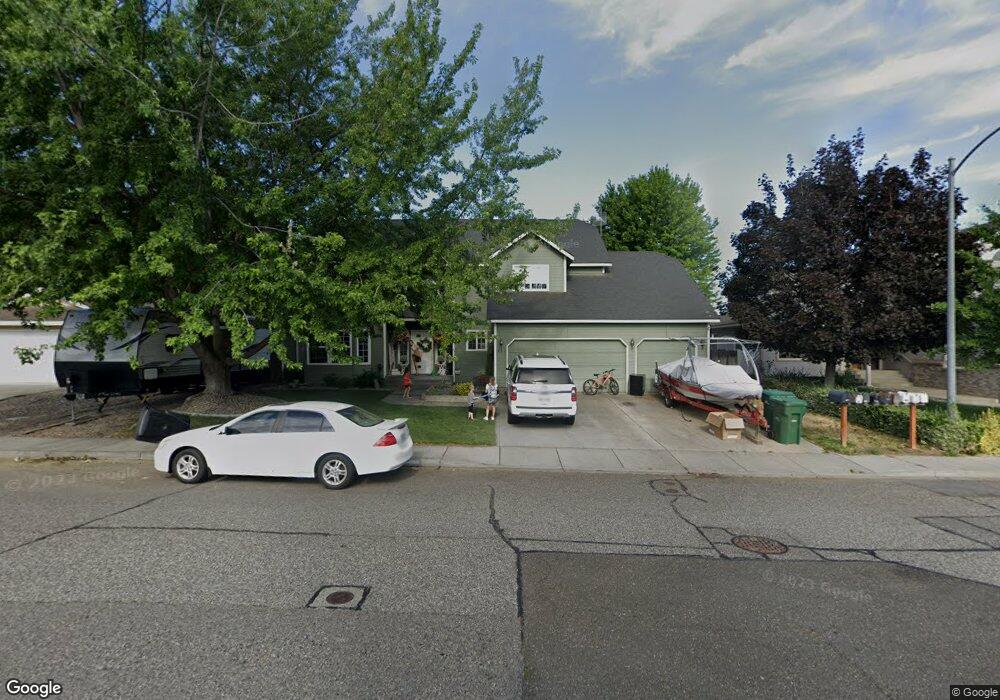
801 N Pittsburg St Unit Over 100k Major remo Kennewick, WA 99336
Estimated Value: $541,673 - $628,000
3
Beds
3
Baths
2,849
Sq Ft
$207/Sq Ft
Est. Value
About This Home
This home is located at 801 N Pittsburg St Unit Over 100k Major remo, Kennewick, WA 99336 and is currently estimated at $590,668, approximately $207 per square foot. 801 N Pittsburg St Unit Over 100k Major remo is a home located in Benton County with nearby schools including Sunset View Elementary School, Desert Hills Middle School, and Kamiakin High School.
Ownership History
Date
Name
Owned For
Owner Type
Purchase Details
Closed on
Aug 8, 2018
Sold by
Babak Pavel V
Bought by
Tefft Kyle and Garvey Knight Danielle C
Current Estimated Value
Home Financials for this Owner
Home Financials are based on the most recent Mortgage that was taken out on this home.
Original Mortgage
$378,000
Outstanding Balance
$328,278
Interest Rate
4.5%
Mortgage Type
VA
Estimated Equity
$262,390
Purchase Details
Closed on
May 20, 2016
Sold by
Stupak Anna and Babak Pavel V
Bought by
Babak Pavel
Home Financials for this Owner
Home Financials are based on the most recent Mortgage that was taken out on this home.
Original Mortgage
$261,350
Interest Rate
3.5%
Mortgage Type
FHA
Purchase Details
Closed on
May 12, 2016
Sold by
Crawford Cary E and Crawford Sherri Mckibben
Bought by
Babak Pavel
Home Financials for this Owner
Home Financials are based on the most recent Mortgage that was taken out on this home.
Original Mortgage
$261,350
Interest Rate
3.5%
Mortgage Type
FHA
Create a Home Valuation Report for This Property
The Home Valuation Report is an in-depth analysis detailing your home's value as well as a comparison with similar homes in the area
Home Values in the Area
Average Home Value in this Area
Purchase History
| Date | Buyer | Sale Price | Title Company |
|---|---|---|---|
| Tefft Kyle | $488,627 | Ticor Tilte | |
| Babak Pavel | -- | Stewart Title Co 1 | |
| Babak Pavel | $277,000 | Stewart Title Co 1 |
Source: Public Records
Mortgage History
| Date | Status | Borrower | Loan Amount |
|---|---|---|---|
| Open | Tefft Kyle | $378,000 | |
| Previous Owner | Babak Pavel | $261,350 |
Source: Public Records
Tax History Compared to Growth
Tax History
| Year | Tax Paid | Tax Assessment Tax Assessment Total Assessment is a certain percentage of the fair market value that is determined by local assessors to be the total taxable value of land and additions on the property. | Land | Improvement |
|---|---|---|---|---|
| 2024 | $4,128 | $547,180 | $70,000 | $477,180 |
| 2023 | $4,128 | $518,260 | $70,000 | $448,260 |
| 2022 | $3,643 | $417,040 | $70,000 | $347,040 |
| 2021 | $3,206 | $373,660 | $70,000 | $303,660 |
| 2020 | $3,250 | $318,540 | $42,000 | $276,540 |
| 2019 | $2,401 | $309,010 | $42,000 | $267,010 |
| 2018 | $2,929 | $232,720 | $42,000 | $190,720 |
| 2017 | $2,690 | $232,720 | $42,000 | $190,720 |
| 2016 | $2,735 | $232,720 | $42,000 | $190,720 |
| 2015 | $3,013 | $232,720 | $42,000 | $190,720 |
| 2014 | -- | $254,490 | $37,000 | $217,490 |
| 2013 | -- | $254,490 | $37,000 | $217,490 |
Source: Public Records
Map
Nearby Homes
- 9005 W John Day Ave
- 8820 W Imnaha Ct
- 9014 W Grand Ronde Ave
- 905 N Pittsburg St
- 8901 W Hood Ave
- 630 Meadows Dr E
- 2404 Mark Ave
- 8704 W Hood Ave
- 708 N Nevada Ct
- 8608 W Imnaha Ave
- 2441 Tiger Ln
- 8712 W Entiat Ave
- 2449 Woods Dr
- 2307 Franz Ct
- 604 Linda Ct
- 8906 W Rio Grande Ave
- 1302 N Montana St
- 8819 W Deschutes Dr
- 8415 W Entiat Place
- 608 Meadows Dr S
- 801 N Pittsburg St Unit 5 Bedrooms! Move In
- 801 N Pittsburg St
- 783 N Pittsburgh St
- 807 N Pittsburg St
- 753 N Pittsburg St
- 802 N Quebec St
- 746 N Quebec St
- 808 N Quebec St
- 747 N Pittsburg St
- 8926 W Klamath Ave
- 813 N Pittsburg St
- 750 N Pittsburg St
- 740 N Quebec St
- 1076 W Klamath Ct
- 1075 W Klamath Ct
- 1088 W Klamath Ct Unit L 21
- 1076 W Klamath Ct Unit L 22
- 1096 W Klamath Ct Unit L 20
- 1087 W Klamath Ct Unit L 19
- 814 N Quebec St