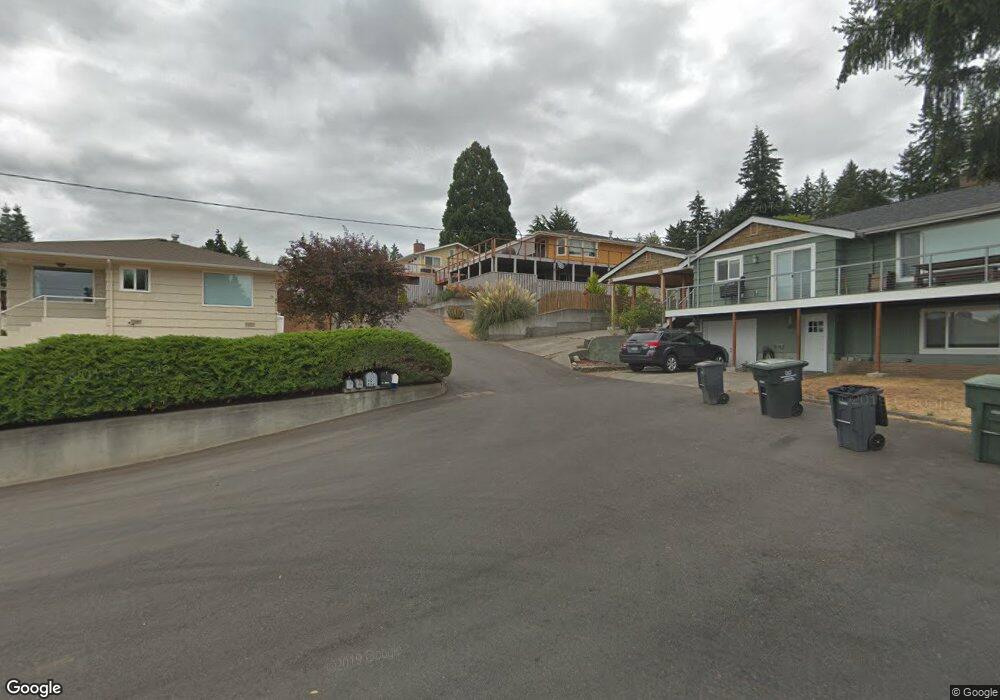
801 NE Matson St Poulsbo, WA 98370
Estimated Value: $769,000 - $1,060,000
4
Beds
2
Baths
1,840
Sq Ft
$482/Sq Ft
Est. Value
About This Home
This home is located at 801 NE Matson St, Poulsbo, WA 98370 and is currently estimated at $887,161, approximately $482 per square foot. 801 NE Matson St is a home located in Kitsap County with nearby schools including Poulsbo Elementary School, Poulsbo Middle School, and North Kitsap High School.
Ownership History
Date
Name
Owned For
Owner Type
Purchase Details
Closed on
Feb 8, 2016
Sold by
Anderson Kendra G and Estate Of Michael J Anderson
Bought by
Hollingswo Danny J Hollingsworth and Hollingswo Amy J
Current Estimated Value
Home Financials for this Owner
Home Financials are based on the most recent Mortgage that was taken out on this home.
Original Mortgage
$175,000
Outstanding Balance
$139,643
Interest Rate
3.98%
Mortgage Type
New Conventional
Estimated Equity
$747,518
Purchase Details
Closed on
Jun 1, 2006
Sold by
Anderson Michael J and Albertsen Anne Marie
Bought by
Anderson Michael J
Home Financials for this Owner
Home Financials are based on the most recent Mortgage that was taken out on this home.
Original Mortgage
$319,800
Interest Rate
6.55%
Mortgage Type
Fannie Mae Freddie Mac
Purchase Details
Closed on
Dec 17, 2001
Sold by
Thul William L and Thul Harriet T
Bought by
Anderson Michael and Anderson Anne Marie
Home Financials for this Owner
Home Financials are based on the most recent Mortgage that was taken out on this home.
Original Mortgage
$190,100
Interest Rate
6.39%
Create a Home Valuation Report for This Property
The Home Valuation Report is an in-depth analysis detailing your home's value as well as a comparison with similar homes in the area
Home Values in the Area
Average Home Value in this Area
Purchase History
| Date | Buyer | Sale Price | Title Company |
|---|---|---|---|
| Hollingswo Danny J Hollingsworth | $375,000 | Land Title Co Silverdale | |
| Anderson Michael J | $94,357 | Transnation Title | |
| Anderson Michael | $196,000 | Transnation Title Insurance |
Source: Public Records
Mortgage History
| Date | Status | Borrower | Loan Amount |
|---|---|---|---|
| Open | Hollingswo Danny J Hollingsworth | $175,000 | |
| Previous Owner | Anderson Michael J | $319,800 | |
| Previous Owner | Anderson Michael | $190,100 |
Source: Public Records
Tax History Compared to Growth
Tax History
| Year | Tax Paid | Tax Assessment Tax Assessment Total Assessment is a certain percentage of the fair market value that is determined by local assessors to be the total taxable value of land and additions on the property. | Land | Improvement |
|---|---|---|---|---|
| 2026 | $6,775 | $755,070 | $208,350 | $546,720 |
| 2025 | $6,775 | $755,070 | $208,350 | $546,720 |
| 2024 | $6,229 | $714,810 | $173,760 | $541,050 |
| 2023 | $6,335 | $714,810 | $173,760 | $541,050 |
| 2022 | $5,626 | $603,600 | $150,830 | $452,770 |
| 2021 | $5,444 | $541,330 | $135,150 | $406,180 |
| 2020 | $5,304 | $518,120 | $129,110 | $389,010 |
| 2019 | $4,967 | $485,160 | $120,670 | $364,490 |
| 2018 | $3,003 | $291,240 | $72,190 | $219,050 |
| 2017 | $3,347 | $291,240 | $72,190 | $219,050 |
| 2016 | $2,916 | $233,710 | $55,530 | $178,180 |
| 2015 | $2,824 | $227,460 | $55,530 | $171,930 |
| 2014 | -- | $218,720 | $55,530 | $163,190 |
| 2013 | -- | $218,720 | $55,530 | $163,190 |
Source: Public Records
Map
Nearby Homes
- 18330 9th Ave NE
- 18664 11th Ave NE
- 18637 Fjord Dr NE
- 493 NE Lincoln Rd
- 17667 State Highway 305 NE
- 0 XX Lemolo Shore Dr NE
- 1610 NE Mount Kamela Ct
- 18552 15th Loop NE
- 0 7th Ave NE Unit NWM2280996
- 600 NE Lincoln Rd Unit 41
- 18130 Sunrise Ridge Ave NE
- 17 Beargrass Ln NE
- 18323 Sunrise Ridge Ave NE
- 17602 NE Midnight Sun Loop
- 17915 Sunrise Ridge Ave NE
- 17787 Sunrise Ridge Ave NE
- 123 NE Whimbrel Ln
- 20249 State Highway 305 NE
- 19463 Scoter Ln NE
- 32 NE Sunset St
- 802 NE Matson St
- 806 NE Matson St
- 18239 9th Ave NE
- 18209 9th Ave NE
- 790 NE Matson St
- 18261 9th Ave NE
- 791 NE Matson St
- 810 NE Matson St
- 19 8th Ave NE
- 18285 9th Ave NE
- 18179 9th Ave NE
- 773 NE Matson St
- 760 NE Matson St
- 0 LOT B 9th Ave NE
- 0 LOT A 9th Ave NE
- 18220 9th Ave NE
- 785 NE Sommerseth St
- 18341 9th Ave NE
- 18248 9th Ave NE
- 753 NE Matson St