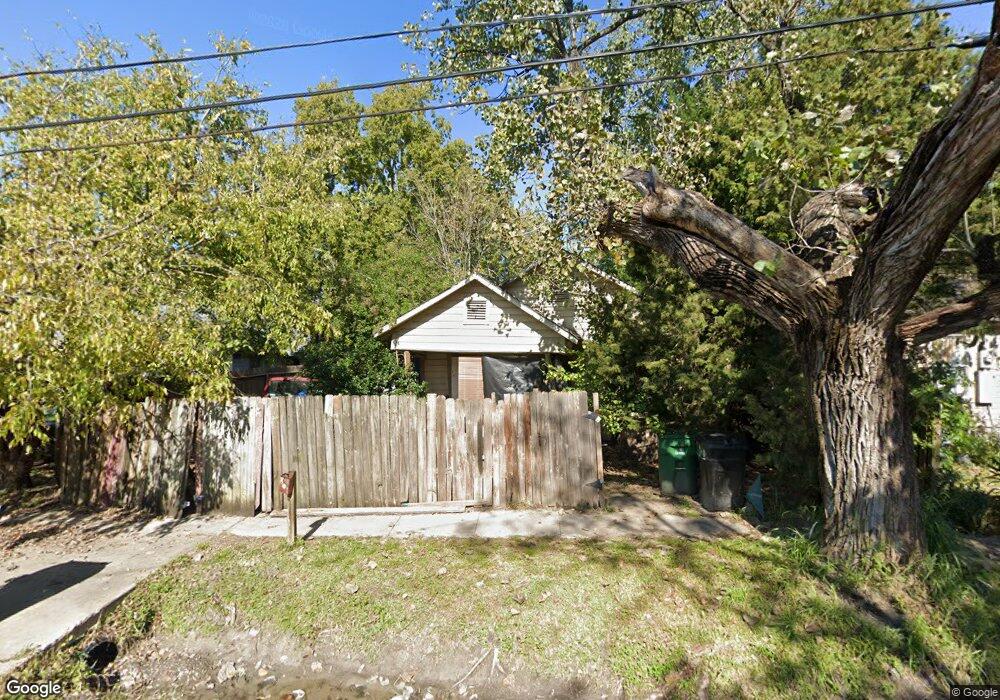
801 Neyland St Houston, TX 77022
Independence Heights NeighborhoodEstimated Value: $302,000 - $344,000
2
Beds
1
Bath
780
Sq Ft
$411/Sq Ft
Est. Value
About This Home
This home is located at 801 Neyland St, Houston, TX 77022 and is currently estimated at $320,333, approximately $410 per square foot. 801 Neyland St is a home located in Harris County with nearby schools including Kennedy Elementary School, Williams Middle, and Booker T Washington Sr High.
Ownership History
Date
Name
Owned For
Owner Type
Purchase Details
Closed on
Jan 31, 2017
Sold by
Doffman Barbara Hill and Hill Sheena O
Bought by
Perez Jose Amado and Perez Guadalupe M
Current Estimated Value
Purchase Details
Closed on
Jan 30, 2017
Sold by
Darkknight Ventures Llc
Bought by
Perez Guadaupe M and Perez Jose Amado
Purchase Details
Closed on
Sep 29, 2016
Sold by
Hill Jenica Deanna
Bought by
Dark Knight Ventures Llc
Purchase Details
Closed on
Jun 6, 1997
Sold by
Kyles Willie E
Bought by
Hill Walter Roy
Create a Home Valuation Report for This Property
The Home Valuation Report is an in-depth analysis detailing your home's value as well as a comparison with similar homes in the area
Home Values in the Area
Average Home Value in this Area
Purchase History
| Date | Buyer | Sale Price | Title Company |
|---|---|---|---|
| Perez Jose Amado | -- | None Available | |
| Perez Guadaupe M | -- | None Available | |
| Dark Knight Ventures Llc | -- | None Available | |
| Hill Walter Roy | -- | Texas American Title Company |
Source: Public Records
Tax History Compared to Growth
Tax History
| Year | Tax Paid | Tax Assessment Tax Assessment Total Assessment is a certain percentage of the fair market value that is determined by local assessors to be the total taxable value of land and additions on the property. | Land | Improvement |
|---|---|---|---|---|
| 2025 | $3,051 | $145,800 | $145,800 | -- |
| 2024 | $3,051 | $145,800 | $145,800 | -- |
| 2023 | $3,051 | $129,600 | $129,600 | $0 |
| 2022 | $2,854 | $129,600 | $129,600 | $0 |
| 2021 | $2,689 | $115,354 | $102,600 | $12,754 |
| 2020 | $2,639 | $108,980 | $97,200 | $11,780 |
| 2019 | $1,621 | $64,067 | $48,600 | $15,467 |
| 2018 | $1,621 | $64,067 | $48,600 | $15,467 |
| 2017 | $1,227 | $48,532 | $32,400 | $16,132 |
| 2016 | $925 | $36,592 | $21,600 | $14,992 |
| 2015 | $956 | $36,974 | $21,600 | $15,374 |
| 2014 | $956 | $37,189 | $14,850 | $22,339 |
Source: Public Records
Map
Nearby Homes
- 821 Neyland St
- 821 Barkley St
- 4303 Castor St
- 4303 Castor Na St
- 4208 Castor St Unit B
- 4208 Castor St Unit A
- 4303 Cadmus St
- 4305 Castor St
- 4206 Oxford St
- 603 Neyland
- 4109 Castor St Unit B
- 4309 Delhi St
- 4220 Delhi St
- 515 E 43rd St
- 508 Neyland St
- 4302 Delhi St
- 606 E 42nd St
- 4311 Europa St
- 436 Neyland St Unit 1
- 431 Neyland St