Estimated Value: $388,000 - $395,000
3
Beds
1
Bath
984
Sq Ft
$397/Sq Ft
Est. Value
About This Home
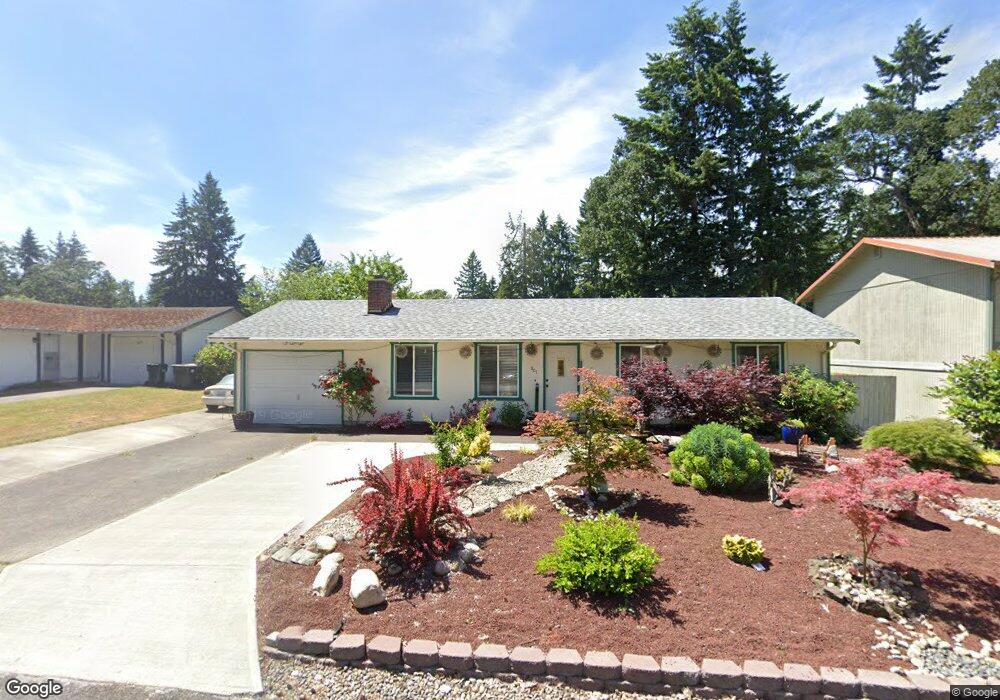
This home is located at 801 Oakcrest St SE, Lacey, WA 98503 and is currently estimated at $390,950, approximately $397 per square foot. 801 Oakcrest St SE is a home located in Thurston County with nearby schools including Seven Oaks Elementary School, Nisqually Middle School, and River Ridge High School.
Ownership History
Date
Name
Owned For
Owner Type
Purchase Details
Closed on
Jan 8, 2007
Sold by
Stiles William M and Stiles Rebecca F
Bought by
Huynh Song and Nguyen Hanh
Current Estimated Value
Home Financials for this Owner
Home Financials are based on the most recent Mortgage that was taken out on this home.
Original Mortgage
$120,000
Outstanding Balance
$13,305
Interest Rate
6.12%
Mortgage Type
Unknown
Estimated Equity
$377,645
Purchase Details
Closed on
Aug 1, 2002
Sold by
Watness Craig M
Bought by
Stiles William M and Stiles Rebecca F
Home Financials for this Owner
Home Financials are based on the most recent Mortgage that was taken out on this home.
Original Mortgage
$112,200
Interest Rate
6.52%
Mortgage Type
VA
Purchase Details
Closed on
Jul 30, 1998
Sold by
Wilson David C and Wilson Theresa M
Bought by
Watness Craig M
Home Financials for this Owner
Home Financials are based on the most recent Mortgage that was taken out on this home.
Original Mortgage
$75,000
Interest Rate
6.9%
Create a Home Valuation Report for This Property
The Home Valuation Report is an in-depth analysis detailing your home's value as well as a comparison with similar homes in the area
Home Values in the Area
Average Home Value in this Area
Purchase History
| Date | Buyer | Sale Price | Title Company |
|---|---|---|---|
| Huynh Song | $190,000 | Chicago Title Company | |
| Stiles William M | $110,000 | Chicago Title Insurance Comp | |
| Watness Craig M | $93,750 | Transnation Title Insurance |
Source: Public Records
Mortgage History
| Date | Status | Borrower | Loan Amount |
|---|---|---|---|
| Open | Huynh Song | $120,000 | |
| Previous Owner | Stiles William M | $112,200 | |
| Previous Owner | Watness Craig M | $75,000 |
Source: Public Records
Tax History Compared to Growth
Tax History
| Year | Tax Paid | Tax Assessment Tax Assessment Total Assessment is a certain percentage of the fair market value that is determined by local assessors to be the total taxable value of land and additions on the property. | Land | Improvement |
|---|---|---|---|---|
| 2024 | $255 | $318,300 | $136,200 | $182,100 |
| 2023 | $255 | $288,100 | $118,600 | $169,500 |
| 2022 | $709 | $298,300 | $90,900 | $207,400 |
| 2021 | $315 | $225,100 | $87,100 | $138,000 |
| 2020 | $319 | $180,600 | $80,800 | $99,800 |
| 2019 | $327 | $167,400 | $68,200 | $99,200 |
| 2018 | $332 | $145,400 | $42,300 | $103,100 |
| 2017 | $356 | $131,250 | $41,850 | $89,400 |
| 2016 | $1,657 | $120,500 | $41,500 | $79,000 |
| 2014 | -- | $115,200 | $41,500 | $73,700 |
Source: Public Records
Map
Nearby Homes
- 816 Oakcrest St SE
- 7815 Royal Oak Dr SE
- 514 Pamela Dr SE
- 848 Vine Maple St SE
- 917 Vine Maple St SE
- 643 School St SE
- 620 Lana Lee Ct SE
- 7938 6th Ave SE
- 610 Cougar St SE
- 7710 Bobcat Dr SE
- 915 Union Mills Rd SE Unit 11
- 7943 4th Ct SE
- 7210 Husky Way SE
- 815 Gregory Way SE
- 8420 Sitka Ct SE
- 8024 N Bicentennial Loop SE
- 6703 5th Way SE
- 6703 5th Ct SE
- 8518 8th Ct SE
- 6725 Husky Way SE
- 815 Oakcrest St SE
- 735 Oakcrest St SE
- 808 Oakcrest Ct SE
- 734 Oakcrest Ct SE
- 812 Oakcrest Ct SE
- 821 Oakcrest St SE
- 729 Oakcrest St SE
- 804 Oakcrest St SE
- 736 Oakcrest St SE
- 814 Oakcrest Ct SE
- 721 Oakcrest St SE
- 730 Oakcrest St SE
- 825 Oakcrest St SE
- 820 Oakcrest St SE
- 906 Oakcrest Dr SE
- 722 Oakcrest St SE
- 805 Oakcrest Ct SE
- 809 Oakcrest Ct SE
- 802 Nottingham Dr SE
- 826 Oakcrest St SE