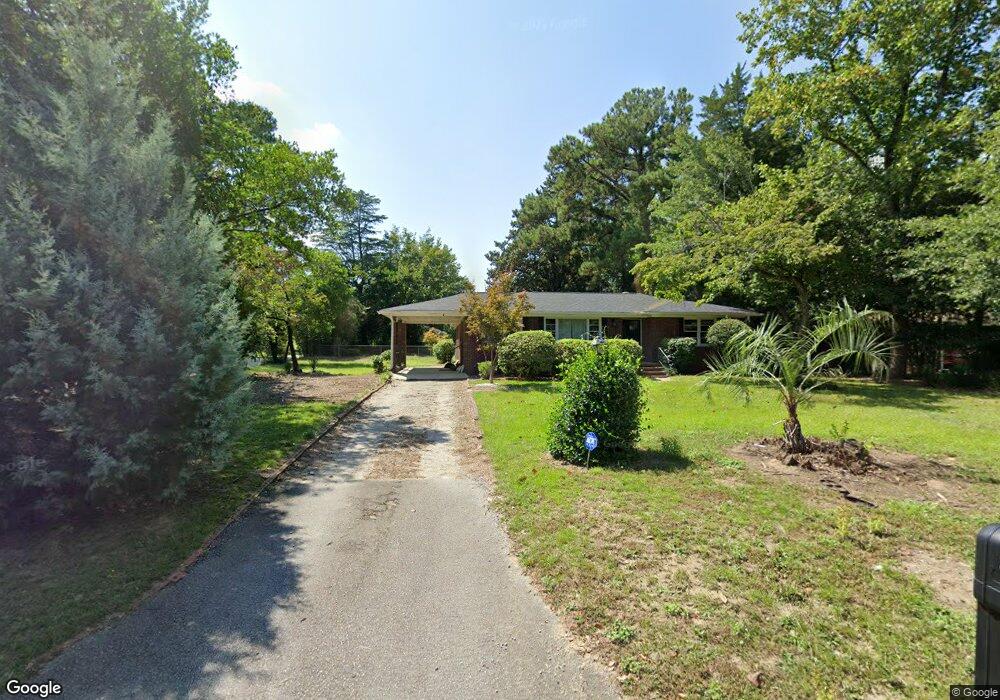
801 Osage Ave West Columbia, SC 29169
Estimated Value: $218,000 - $258,180
3
Beds
2
Baths
1,570
Sq Ft
$156/Sq Ft
Est. Value
About This Home
This home is located at 801 Osage Ave, West Columbia, SC 29169 and is currently estimated at $245,295, approximately $156 per square foot. 801 Osage Ave is a home located in Lexington County with nearby schools including Saluda River Academy For The Arts, Northside Middle, and Brookland-Cayce High School.
Ownership History
Date
Name
Owned For
Owner Type
Purchase Details
Closed on
Sep 24, 2022
Sold by
Abouelkhair Osama M
Bought by
Harris Elizabeth Gail
Current Estimated Value
Home Financials for this Owner
Home Financials are based on the most recent Mortgage that was taken out on this home.
Original Mortgage
$196,072
Outstanding Balance
$187,409
Interest Rate
5.13%
Mortgage Type
FHA
Estimated Equity
$57,886
Purchase Details
Closed on
Jul 13, 2021
Sold by
John Mathew and Thomason Rachel
Bought by
Abouelkhair Osama M
Home Financials for this Owner
Home Financials are based on the most recent Mortgage that was taken out on this home.
Original Mortgage
$182,532
Interest Rate
2.9%
Mortgage Type
FHA
Purchase Details
Closed on
Sep 14, 2014
Sold by
Thomason Rachel and Thomason Rachel R
Bought by
John Mathew and Thomason Rachel
Purchase Details
Closed on
Oct 10, 2012
Sold by
Porter Properties Llc
Bought by
Thomason Rachel R
Home Financials for this Owner
Home Financials are based on the most recent Mortgage that was taken out on this home.
Original Mortgage
$122,278
Interest Rate
3.5%
Mortgage Type
FHA
Purchase Details
Closed on
Feb 23, 2012
Sold by
The United States Department Of Housing
Bought by
Porter Properties Llc
Home Financials for this Owner
Home Financials are based on the most recent Mortgage that was taken out on this home.
Original Mortgage
$115,260
Interest Rate
3.89%
Mortgage Type
Future Advance Clause Open End Mortgage
Purchase Details
Closed on
Sep 28, 2011
Sold by
Jpmorgan Chase Bank National Association
Bought by
Secretary Of Housing & Urban Development
Purchase Details
Closed on
Jun 20, 2011
Sold by
Lesesne Benjamin H and Lesesne Benjamin Howard
Bought by
Chase Home Finance Llc
Purchase Details
Closed on
Mar 5, 2008
Sold by
Mccoy Greg A
Bought by
Lesesne Benjamin H
Home Financials for this Owner
Home Financials are based on the most recent Mortgage that was taken out on this home.
Original Mortgage
$112,157
Interest Rate
5.63%
Mortgage Type
FHA
Purchase Details
Closed on
May 24, 2006
Sold by
Lesesne Benjamin H and Lesesne Benjamin Howard
Bought by
Mccoy Greg A
Home Financials for this Owner
Home Financials are based on the most recent Mortgage that was taken out on this home.
Original Mortgage
$104,000
Interest Rate
6.41%
Mortgage Type
New Conventional
Purchase Details
Closed on
Apr 24, 1998
Sold by
Jackson Robert H
Bought by
Lesesne Benjamin H
Create a Home Valuation Report for This Property
The Home Valuation Report is an in-depth analysis detailing your home's value as well as a comparison with similar homes in the area
Home Values in the Area
Average Home Value in this Area
Purchase History
| Date | Buyer | Sale Price | Title Company |
|---|---|---|---|
| Harris Elizabeth Gail | $210,000 | -- | |
| Abouelkhair Osama M | $185,900 | None Available | |
| John Mathew | -- | -- | |
| Thomason Rachel R | $126,500 | -- | |
| Porter Properties Llc | $72,450 | -- | |
| Secretary Of Housing & Urban Development | -- | -- | |
| Chase Home Finance Llc | $2,500 | -- | |
| Lesesne Benjamin H | $130,000 | None Available | |
| Mccoy Greg A | $130,000 | None Available | |
| Lesesne Benjamin H | $85,000 | -- |
Source: Public Records
Mortgage History
| Date | Status | Borrower | Loan Amount |
|---|---|---|---|
| Open | Harris Elizabeth Gail | $196,072 | |
| Previous Owner | Abouelkhair Osama M | $182,532 | |
| Previous Owner | Thomason Rachel R | $122,278 | |
| Previous Owner | Porter Properties Llc | $115,260 | |
| Previous Owner | Lesesne Benjamin H | $112,157 | |
| Previous Owner | Mccoy Greg A | $104,000 |
Source: Public Records
Tax History Compared to Growth
Tax History
| Year | Tax Paid | Tax Assessment Tax Assessment Total Assessment is a certain percentage of the fair market value that is determined by local assessors to be the total taxable value of land and additions on the property. | Land | Improvement |
|---|---|---|---|---|
| 2024 | $1,559 | $8,400 | $1,400 | $7,000 |
| 2023 | $1,605 | $11,154 | $2,100 | $9,054 |
| 2022 | $950 | $11,154 | $2,100 | $9,054 |
| 2020 | $962 | $5,194 | $1,400 | $3,794 |
| 2019 | $961 | $5,077 | $1,400 | $3,677 |
| 2018 | $971 | $5,077 | $1,400 | $3,677 |
| 2017 | $931 | $5,077 | $1,400 | $3,677 |
| 2016 | $958 | $5,076 | $1,400 | $3,676 |
| 2014 | $736 | $5,129 | $1,400 | $3,729 |
| 2013 | -- | $5,070 | $1,400 | $3,670 |
Source: Public Records
Map
Nearby Homes
- 638 Carrington Dr
- 816 Fontanna Ave
- 1344 Gilmore St
- 929-931 Central Dr
- 502A Koon St
- 1100 Seminole Dr
- 916 Mohegan Trail
- 918 N Lucas St
- 941 Mohegan Trail
- 1513 Gambrell St
- 633 Edgewater Ln
- 634 Edgewater Ln
- 225 Edgewater Ln
- 617 Holland Cir
- 121 Edgewater Ln
- 1235 Jensen St
- 324 N Parson St
- 103 Chicorana Rd
- 106 Earl Ct
- 1715 Gilvie Ave
- 805 Osage Ave
- 703 Osage Ave
- 800 Seminole Dr
- 802 Seminole Dr
- 800 Osage Ave
- 701 Osage Ave
- 701 Osage Ave Unit 4
- 701 Osage Ave Unit 5
- 701 Osage Ave Unit 7
- 701 Osage Ave Unit 4
- 701 Osage Ave Unit 3
- 701 Osage Ave Unit 8
- 701 Osage Ave Unit 2
- 807 Osage Ave
- 804 Osage Ave
- 804 Seminole Dr
- 704 Osage Ave Unit 3
- 704 Osage Ave Unit 8
- 704 Osage Ave Unit 7
- 704 Osage Ave Unit 2