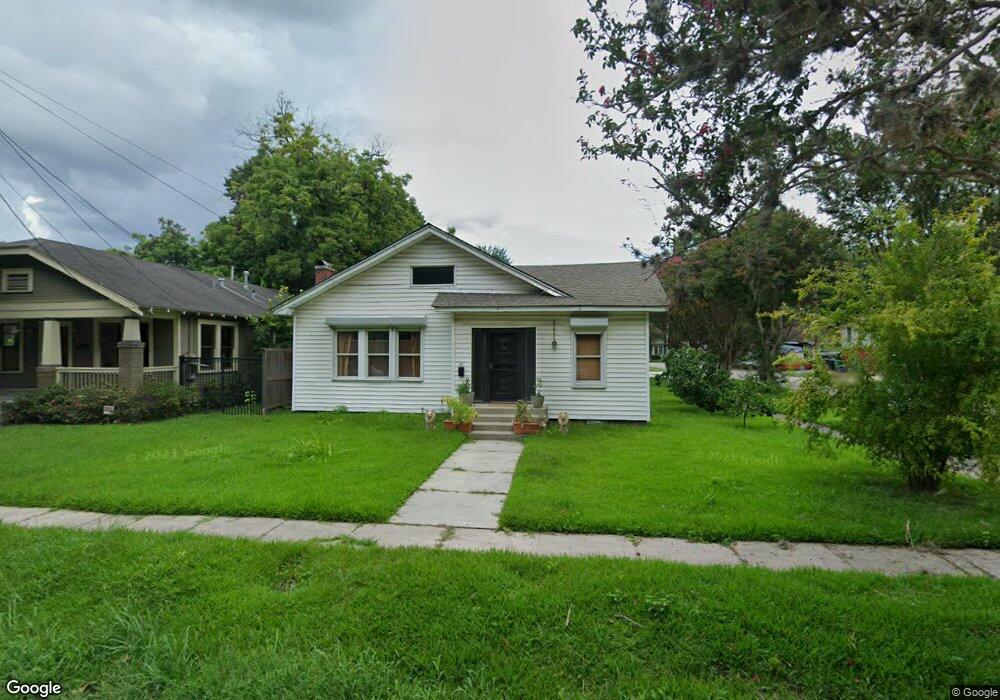
801 Redan St Houston, TX 77009
Greater Heights NeighborhoodEstimated Value: $771,674 - $1,130,000
3
Beds
3
Baths
3,122
Sq Ft
$281/Sq Ft
Est. Value
About This Home
This home is located at 801 Redan St, Houston, TX 77009 and is currently estimated at $878,419, approximately $281 per square foot. 801 Redan St is a home located in Harris County with nearby schools including Travis Elementary School, Hogg Middle, and Heights High School.
Ownership History
Date
Name
Owned For
Owner Type
Purchase Details
Closed on
Nov 22, 2013
Sold by
Schelling Myra Jane and Tilbury Mary
Bought by
Rice James L and Rice Shelley D
Current Estimated Value
Home Financials for this Owner
Home Financials are based on the most recent Mortgage that was taken out on this home.
Original Mortgage
$32,800
Outstanding Balance
$24,519
Interest Rate
4.29%
Mortgage Type
New Conventional
Estimated Equity
$853,900
Purchase Details
Closed on
Nov 27, 2001
Sold by
Browning Patricia Moss
Bought by
Schelling Myra Jane
Create a Home Valuation Report for This Property
The Home Valuation Report is an in-depth analysis detailing your home's value as well as a comparison with similar homes in the area
Home Values in the Area
Average Home Value in this Area
Purchase History
| Date | Buyer | Sale Price | Title Company |
|---|---|---|---|
| Rice James L | -- | Tradition Title Co | |
| Schelling Myra Jane | -- | -- |
Source: Public Records
Mortgage History
| Date | Status | Borrower | Loan Amount |
|---|---|---|---|
| Open | Rice James L | $32,800 |
Source: Public Records
Tax History Compared to Growth
Tax History
| Year | Tax Paid | Tax Assessment Tax Assessment Total Assessment is a certain percentage of the fair market value that is determined by local assessors to be the total taxable value of land and additions on the property. | Land | Improvement |
|---|---|---|---|---|
| 2025 | $13,762 | $620,585 | $562,500 | $58,085 |
| 2024 | $13,762 | $657,743 | $562,500 | $95,243 |
| 2023 | $13,762 | $615,523 | $506,250 | $109,273 |
| 2022 | $12,222 | $555,055 | $466,875 | $88,180 |
| 2021 | $13,479 | $561,780 | $450,000 | $111,780 |
| 2020 | $13,900 | $574,023 | $500,000 | $74,023 |
| 2019 | $14,702 | $581,000 | $500,000 | $81,000 |
| 2018 | $12,279 | $485,256 | $400,000 | $85,256 |
| 2017 | $12,270 | $485,256 | $400,000 | $85,256 |
| 2016 | $11,379 | $450,000 | $360,000 | $90,000 |
| 2015 | $10,502 | $462,685 | $337,500 | $125,185 |
| 2014 | $10,502 | $408,540 | $303,750 | $104,790 |
Source: Public Records
Map
Nearby Homes