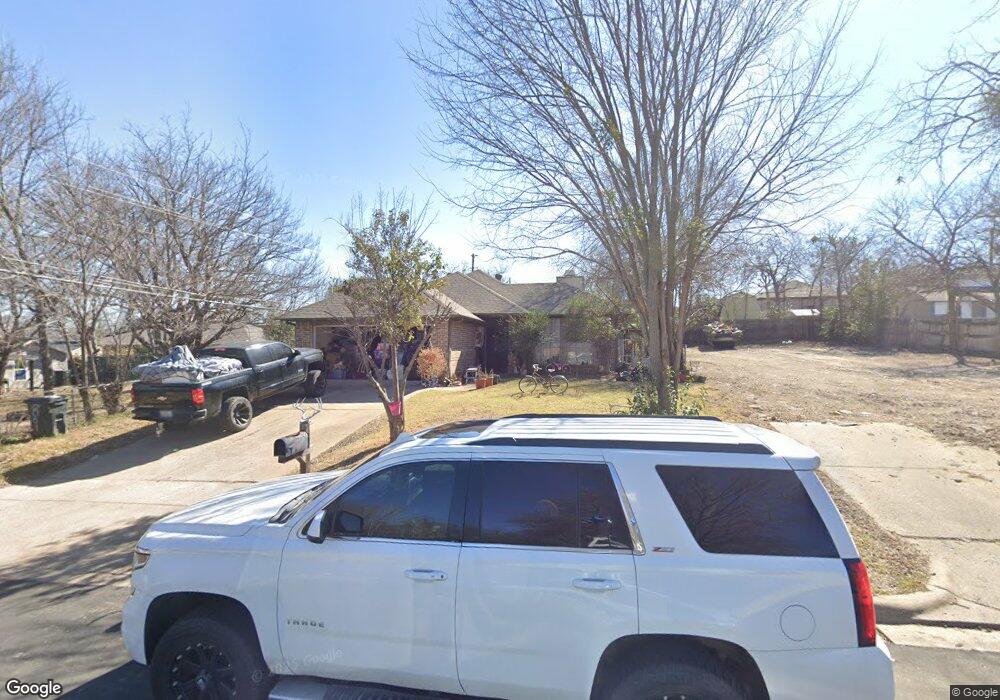
801 Rumfield Rd Fort Worth, TX 76108
Estimated Value: $183,000 - $275,000
3
Beds
2
Baths
1,295
Sq Ft
$170/Sq Ft
Est. Value
About This Home
This home is located at 801 Rumfield Rd, Fort Worth, TX 76108 and is currently estimated at $220,110, approximately $169 per square foot. 801 Rumfield Rd is a home located in Tarrant County with nearby schools including Liberty Elementary School, Brewer Middle School, and Tannahill Intermediate School.
Ownership History
Date
Name
Owned For
Owner Type
Purchase Details
Closed on
Feb 17, 2012
Sold by
Ahnert Beverly
Bought by
Ahnert Beverly
Current Estimated Value
Purchase Details
Closed on
May 18, 2006
Sold by
Wm Specialty Mortgage Llc
Bought by
Alfaro Jose
Home Financials for this Owner
Home Financials are based on the most recent Mortgage that was taken out on this home.
Original Mortgage
$79,000
Outstanding Balance
$46,171
Interest Rate
6.56%
Mortgage Type
Fannie Mae Freddie Mac
Estimated Equity
$173,939
Purchase Details
Closed on
Jan 13, 2006
Sold by
Galvan Terry and Galvan Cynthia
Bought by
Wm Specialty Mortgage Llc
Purchase Details
Closed on
Feb 10, 2003
Sold by
Galvan Cynthia
Bought by
Galvan Terry
Purchase Details
Closed on
Aug 26, 1994
Sold by
Bankers Trust Company Of California Na
Bought by
Felkner Billy James and Felkner Barbara
Create a Home Valuation Report for This Property
The Home Valuation Report is an in-depth analysis detailing your home's value as well as a comparison with similar homes in the area
Home Values in the Area
Average Home Value in this Area
Purchase History
| Date | Buyer | Sale Price | Title Company |
|---|---|---|---|
| Ahnert Beverly | -- | None Available | |
| Alfaro Jose | -- | None Available | |
| Wm Specialty Mortgage Llc | $80,295 | None Available | |
| Galvan Terry | -- | Safeco Land Title | |
| Felkner Billy James | -- | -- |
Source: Public Records
Mortgage History
| Date | Status | Borrower | Loan Amount |
|---|---|---|---|
| Open | Alfaro Jose | $79,000 |
Source: Public Records
Tax History Compared to Growth
Tax History
| Year | Tax Paid | Tax Assessment Tax Assessment Total Assessment is a certain percentage of the fair market value that is determined by local assessors to be the total taxable value of land and additions on the property. | Land | Improvement |
|---|---|---|---|---|
| 2025 | $3,166 | $227,046 | $37,295 | $189,751 |
| 2024 | $3,166 | $227,046 | $37,295 | $189,751 |
| 2023 | $4,383 | $228,576 | $37,295 | $191,281 |
| 2022 | $4,539 | $174,597 | $25,000 | $149,597 |
| 2021 | $4,191 | $163,159 | $25,000 | $138,159 |
| 2020 | $3,838 | $147,068 | $25,000 | $122,068 |
| 2019 | $3,622 | $148,021 | $25,000 | $123,021 |
| 2018 | $2,738 | $114,466 | $12,000 | $102,466 |
| 2017 | $3,041 | $111,999 | $12,000 | $99,999 |
| 2016 | $2,765 | $106,386 | $12,000 | $94,386 |
| 2015 | $2,470 | $86,000 | $10,000 | $76,000 |
| 2014 | $2,470 | $86,000 | $10,000 | $76,000 |
Source: Public Records
Map
Nearby Homes
- 809 Mirike Dr
- 8400 Wyatt Dr
- 8500 Wyatt Dr
- 911 Rumfield Rd
- 8232 Redonda St
- 633 Kimbrough St
- 8237 Albert St
- 8316 Sussex St
- 872 June Dr
- 8437 Redonda St
- 8203 Delmar St
- 8354 Sussex St
- 8508 Michael St
- 800 Pemberton St
- 501 Pemberton St
- 801 Ala Dr
- 8224 Carlos St
- 537 June Dr
- 321 Meadow Park Dr
- 8528 Pemberton Ct
- 803 Rumfield Rd
- 813 Rumfield Rd
- 805 Rumfield Rd
- 8265 Kender Ln
- 802 N Ridge Dr
- 8261 Kender Ln
- 8255 Kender Ln
- 804 N Ridge Dr
- 821 Rumfield Rd
- 806 N Ridge Dr
- 8301 Kender Ln
- 800 Rumfield Rd
- 8251 Kender Ln
- 802 Rumfield Rd
- 825 Rumfield Rd
- 804 Rumfield Rd
- 808 N Ridge Dr
- 8305 Kender Ln
- 806 Rumfield Rd
- 829 Rumfield Rd