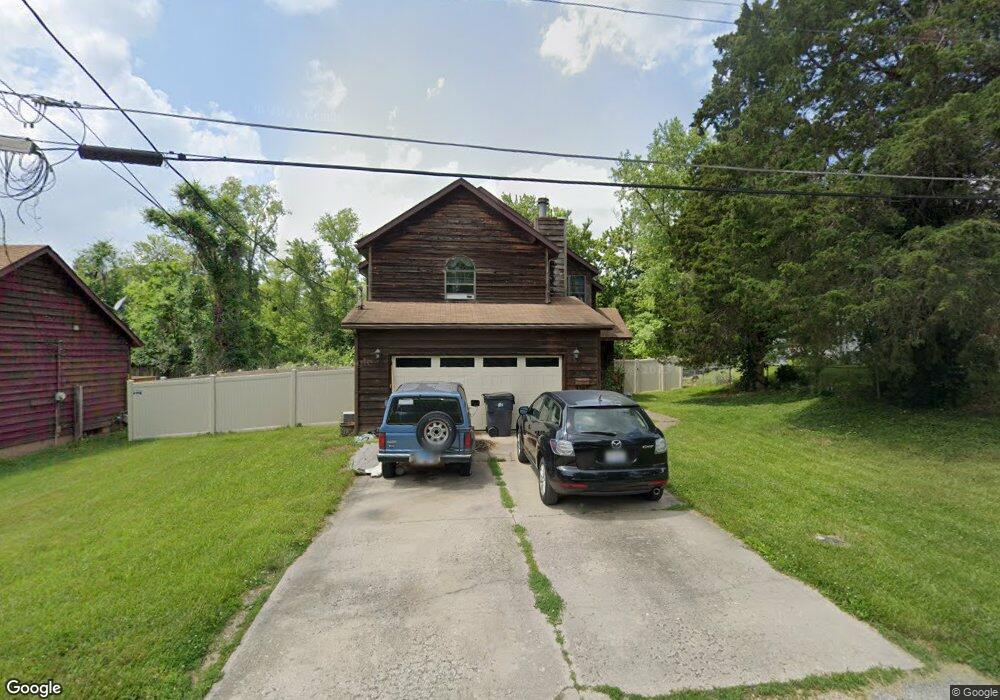
801 S 19th St Belleville, IL 62226
Estimated Value: $69,000 - $166,000
3
Beds
3
Baths
2,449
Sq Ft
$55/Sq Ft
Est. Value
About This Home
This home is located at 801 S 19th St, Belleville, IL 62226 and is currently estimated at $133,871, approximately $54 per square foot. 801 S 19th St is a home located in St. Clair County with nearby schools including Union Elementary School, West Jr High School, and Governor French Academy.
Ownership History
Date
Name
Owned For
Owner Type
Purchase Details
Closed on
Jan 31, 2014
Sold by
Federal National Mortgage Association
Bought by
Taylor Dale
Current Estimated Value
Purchase Details
Closed on
Apr 10, 2002
Sold by
Federal National Mortgage Association
Bought by
Tyra Amanda M
Home Financials for this Owner
Home Financials are based on the most recent Mortgage that was taken out on this home.
Original Mortgage
$84,600
Interest Rate
8.87%
Mortgage Type
Purchase Money Mortgage
Purchase Details
Closed on
Feb 21, 2002
Sold by
Holmes Sandranella
Bought by
Federal National Mortgage Association
Home Financials for this Owner
Home Financials are based on the most recent Mortgage that was taken out on this home.
Original Mortgage
$84,600
Interest Rate
8.87%
Mortgage Type
Purchase Money Mortgage
Create a Home Valuation Report for This Property
The Home Valuation Report is an in-depth analysis detailing your home's value as well as a comparison with similar homes in the area
Home Values in the Area
Average Home Value in this Area
Purchase History
We collect this data history from publicly available records. To have your information removed, we recommend requesting removal directly through your county’s website.
| Date | Buyer | Sale Price | Title Company |
|---|---|---|---|
| Taylor Dale | $53,000 | Servicelink | |
| Tyra Amanda M | -- | -- | |
| Federal National Mortgage Association | $85,755 | -- |
Source: Public Records
Mortgage History
We collect this data history from publicly available records. To have your information removed, we recommend requesting removal directly through your county’s website.
| Date | Status | Borrower | Loan Amount |
|---|---|---|---|
| Previous Owner | Tyra Amanda M | $84,600 |
Source: Public Records
Tax History
| Year | Tax Paid | Tax Assessment Tax Assessment Total Assessment is a certain percentage of the fair market value that is determined by local assessors to be the total taxable value of land and additions on the property. | Land | Improvement |
|---|---|---|---|---|
| 2024 | $3,820 | $43,437 | $3,243 | $40,194 |
| 2023 | $3,488 | $37,158 | $3,179 | $33,979 |
| 2022 | $3,202 | $33,452 | $2,862 | $30,590 |
| 2021 | $3,083 | $30,926 | $2,646 | $28,280 |
| 2020 | $2,997 | $29,245 | $2,502 | $26,743 |
| 2019 | $3,252 | $31,390 | $2,506 | $28,884 |
| 2018 | $3,180 | $30,711 | $2,452 | $28,259 |
| 2017 | $3,155 | $30,496 | $2,435 | $28,061 |
| 2016 | $3,115 | $29,848 | $2,383 | $27,465 |
| 2014 | $2,129 | $46,054 | $2,023 | $44,031 |
| 2013 | $4,214 | $46,713 | $2,052 | $44,661 |
Source: Public Records
Map
Nearby Homes
Your Personal Tour Guide
Ask me questions while you tour the home.